


Reading an EKG strip is one of the harder parts of nursing school.
When a real strip lands in front of a student for the first time, it can feel overwhelming.
An EKG interpretation cheat sheet changes that. Instead of memorizing every rhythm from scratch, it gives a quick reference for rate, rhythm, and common waveforms. It feels less intimidating once you have a plan for reading them.
Once the basics click, most strips break down into the same handful of patterns.
Students who trade memorization for a repeatable system read strips faster and catch more on the first pass.
This blog covers how to read a strip step by step, common abnormal rhythms, and a cheat-sheet format that’s easy to keep on hand in clinicals.
Disclaimer: This is for educational purposes and isn’t a substitute for formal clinical training or professional interpretation.
What Is an EKG and What Does It Show?
EKG and ECG refer to the exact same test, an electrocardiogram.
The “EKG” spelling traces back to the German “Elektrokardiogramm,” coined by Willem Einthoven.
A single EKG can offer surprising insight into how the heart functions electrically.
It helps evaluate heart rate, rhythm, and electrical conduction, as well as how well signals travel from the atria to the ventricles.
It also reveals arrhythmias like atrial fibrillation, heart blocks, possible ischemic changes suggesting reduced blood flow, and chamber abnormalities like enlargement or strain.
Because it captures a real-time snapshot of the heart’s electrical activity, an EKG remains one of the fastest, most accessible diagnostic tools in both emergency and routine care.
Understanding the Basicsof an EKG Strip
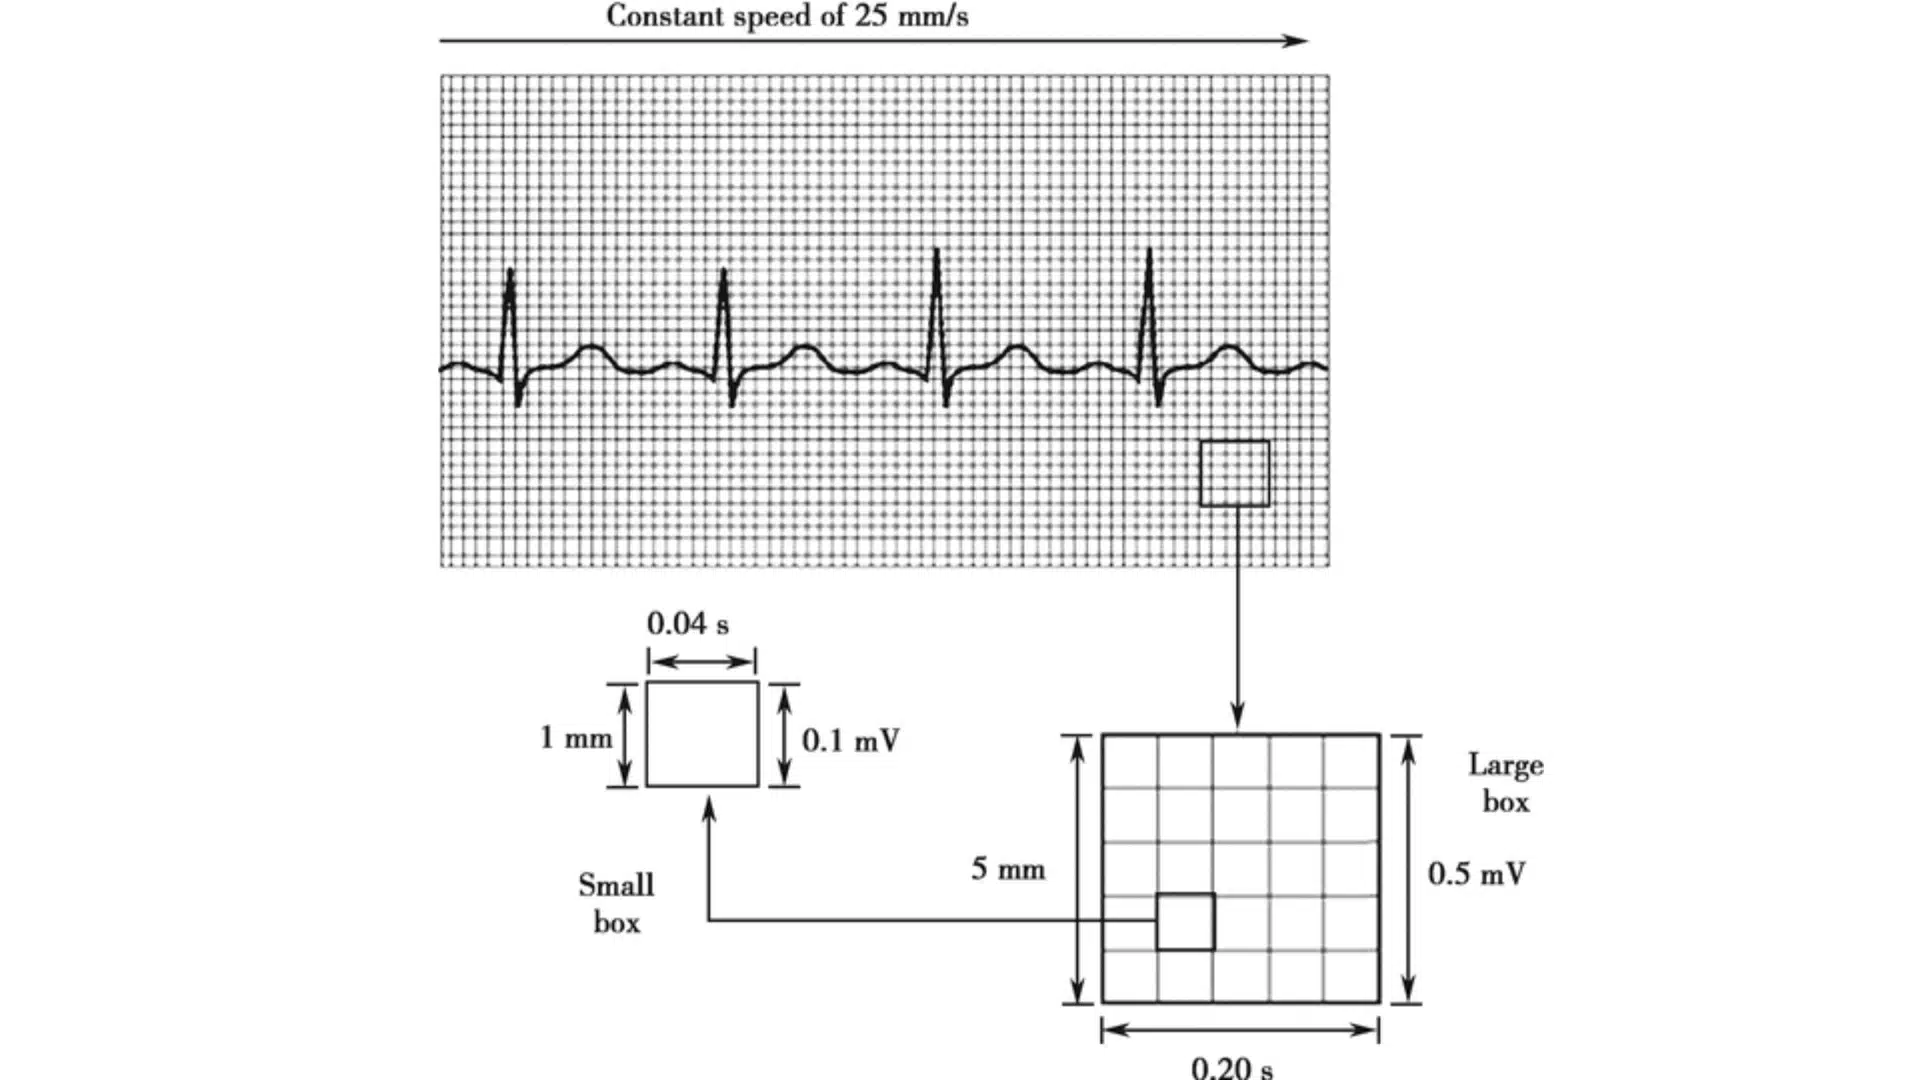
Source: Springer Nature
Every EKG is recorded on graph paper, and understanding the grid is the foundation for all subsequent measurements.
The paper is divided into small and large boxes, each representing a fixed unit of time and voltage.
This grid is what makes the entire interpretation process measurable rather than just visual.
It’s used to calculate heart rate by counting the boxes between beats and measure intervals like PR, QRS, and QT by counting boxes across a given waveform.
It also identifies rhythm patterns by comparing the spacing and consistency of beats over time.
Every step in the interpretation process that follows relies on accurately reading this grid first.
EKG: Waveforms, Segments, and Intervals
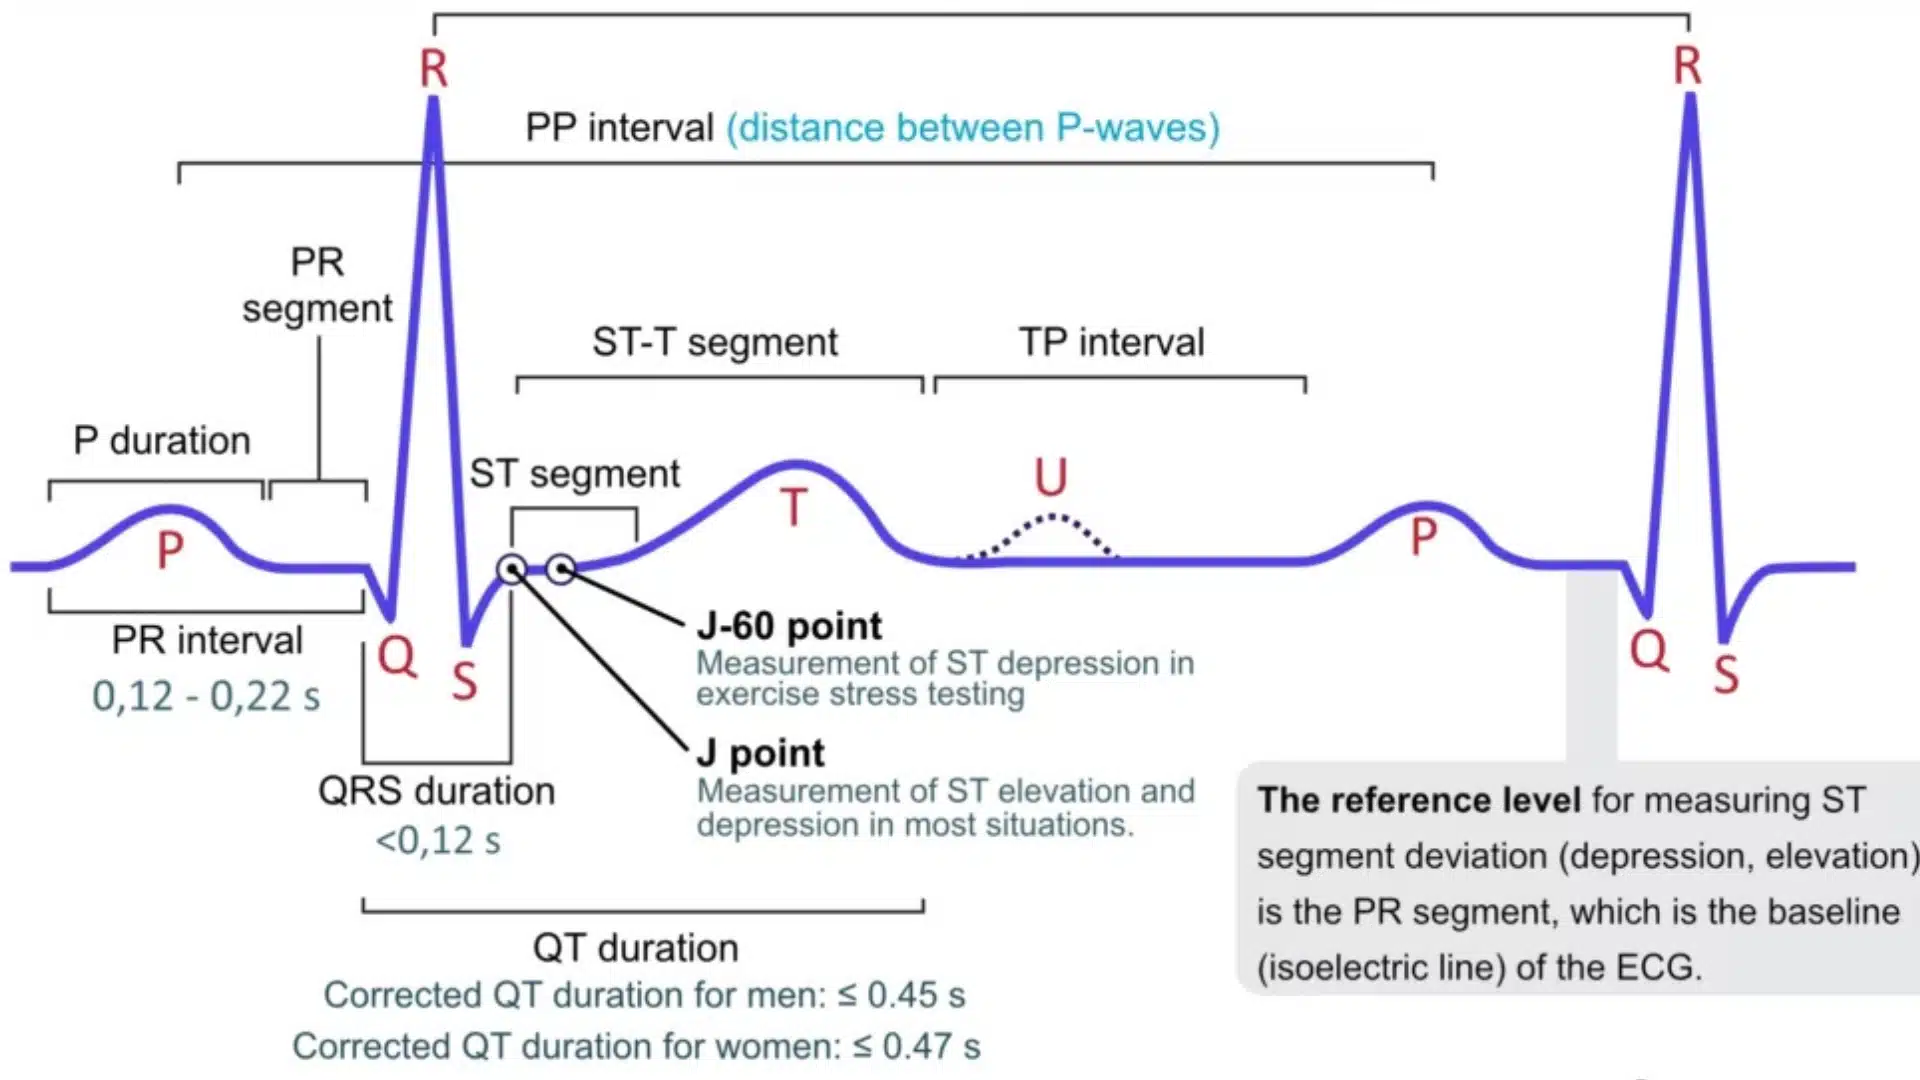
Source: Ecgwaves.com
Every EKG tracing has a repeating pattern of waves and segments that show specific electrical events in the heart’s cycle.
1. P Wave
The P wave represents atrial depolarization, the electrical signal spreading across the atria just before they contract.
In a normal sinus rhythm, it should appear upright and rounded in most leads, with a consistent shape from beat to beat.
Abnormal P waves- ones that are absent, irregular in shape, or vary from beat to beat- can point to conditions like atrial fibrillation, atrial enlargement, or an ectopic atrial rhythm.
2. QRS Complex
The QRS complex represents ventricular depolarization, the electrical signal that triggers the ventricles to contract.
A narrow QRS (80–100 ms) typically indicates the signal is traveling through the heart’s normal conduction pathway.
A wide QRS (≥120 ms) suggests the signal is taking a slower, abnormal route, often due to a bundle branch block or a rhythm originating from the ventricles themselves rather than the normal conduction system.
3. T Wave
The T wave represents ventricular repolarization, the heart muscle “resetting” electrically after each contraction.
It’s typically upright in most leads.
Abnormal T waves, inverted, flattened, or unusually tall and peaked, can be associated with ischemia, electrolyte imbalances (like hyperkalemia causing tall, tented T waves), or other underlying cardiac conditions.
4. ST Segment
The ST segment sits between the end of the QRS complex and the start of the T wave, and it’s one of the most clinically significant parts of the entire tracing.
Normally flat and level with the baseline, ST elevation or depression is a key indicator of possible myocardial ischemia or injury, findings that often require urgent clinical attention.
5. U Wave
The U wave is a small, often subtle wave that occasionally follows the T wave.
It isn’t always visible, and when it is, it’s typically low in amplitude. A prominent U wave can be associated with hypokalemia, certain medications, or bradycardia.
It’s one of the less commonly emphasized components in routine interpretation.
Step-by-Step Process: EKG Interpretation Method

A standardized checklist to follow for every EKG, no matter how complex.
Step 1: Check Patient Information and EKG Quality
Before analyzing any waveform, confirm the basics: correct patient details, date and time, proper lead placement, and calibration (the standardization square at the start of the tracing).
Also rule out artifacts, poor electrode contact, patient movement, or muscle tremor, which can all mimic abnormal findings that aren’t actually present.
Step 2: Calculate Heart Rate
For regular rhythms, use the 300 method: count the large boxes between two consecutive R waves and divide 300 by that number.
For irregular rhythms, use the 6-second method: count the QRS complexes in a 6-second strip and multiply by 10.
Step 3: Determine Rhythm Regularity
Assess the consistency of the R-R intervals across the strip.
A rhythm can be regular, irregular, regularly irregular (a repeating pattern of irregularity), or irregularly irregular (no discernible pattern at all, the hallmark of atrial fibrillation).
Step 4: Analyze P Waves
Confirm that P waves are present, consistent in shape, and that each one is followed by a QRS complex.
Missing, variable, or absent P waves can indicate anything from an ectopic rhythm to atrial fibrillation.
Step 5: Measure PR Interval
The normal range is 120–200 ms. A short PR interval may suggest pre-excitation (such as Wolff-Parkinson-White syndrome). While a prolonged PR interval points toward some degree of AV block.
Step 6: Evaluate QRS Complex
Normal QRS duration falls between 80–100 ms. Anything ≥120 ms is considered wide.
It should prompt a look for bundle branch block patterns or a ventricular origin to the rhythm.
Step 7: Review ST Segment and T Waves
Finally, check for ST elevation or depression, and note any T wave inversion, peaking, or flattening.
These findings are often the clearest signal of ischemia, injury, or electrolyte disturbance, and shouldn’t be overlooked even if everything else on the strip appears normal.
This habit extends beyond nursing boards. Medical assistant exam candidates must recognize the same rate, rhythm, and interval basics during clinical skills training.
Download Your EKG Interpretation Cheat Sheet PDF: Between the grid measurements, the7-step method, and the rhythm reference table, there’s a lot to keep track of. Which is exactly why we’ve put it all in one place.
EKG Interpretation Cheat Sheet: Normal Values & Rhythm Guide
This quick-reference combines measurements with rhythms to help identify normal and abnormal patterns.
Normal EKG Measurements Cheat Sheet
Quick reference for the standard values every normal EKG should fall within.
EKG Component | Normal Finding | What It Represents |
|---|---|---|
Heart Rate | 60–100 bpm | Number of heartbeats per minute |
Rhythm | Regular | Consistent spacing between beats |
P Wave | Present, upright, consistent | Atrial depolarization |
PR Interval | 120–200 ms | Time for impulse travel from atria to ventricles |
QRS Duration | Less than 120 ms | Ventricular depolarization |
ST Segment | Flat, no elevation or depression | Period between ventricular depolarization and repolarization |
T Wave | Upright in most leads | Ventricular repolarization |
QT Interval | Varies with heart rate | Total ventricular electrical activity |
Common EKG Rhythm Identification Cheat Sheet
A fast way to match what you’re seeing on the strip to the rhythm it actually represents.
Rhythm | Heart Rate | Key EKG Features |
|---|---|---|
Normal Sinus Rhythm | 60–100 bpm | Regular rhythm, normal P waves, normal PR and QRS |
Sinus Bradycardia | Below 60 bpm | Normal rhythm pattern but slower rate |
Sinus Tachycardia | Above 100 bpm | Normal rhythm pattern but faster rate |
Atrial Fibrillation | Variable | Irregularly irregular rhythm, absent clear P waves |
Atrial Flutter | Usually 150 bpm ventricular rate | Sawtooth flutter waves, organized atrial activity |
Ventricular Tachycardia | Usually above 100 bpm | Rapid wide-complex ventricular rhythm |
Ventricular Fibrillation | Chaotic | No organized P waves or QRS complexes |
Common EKG Rhythms Explained
A quick reference of the most frequently encountered rhythms, from normal sinus rhythm to life-threatening emergencies.
1. Normal Rhythm
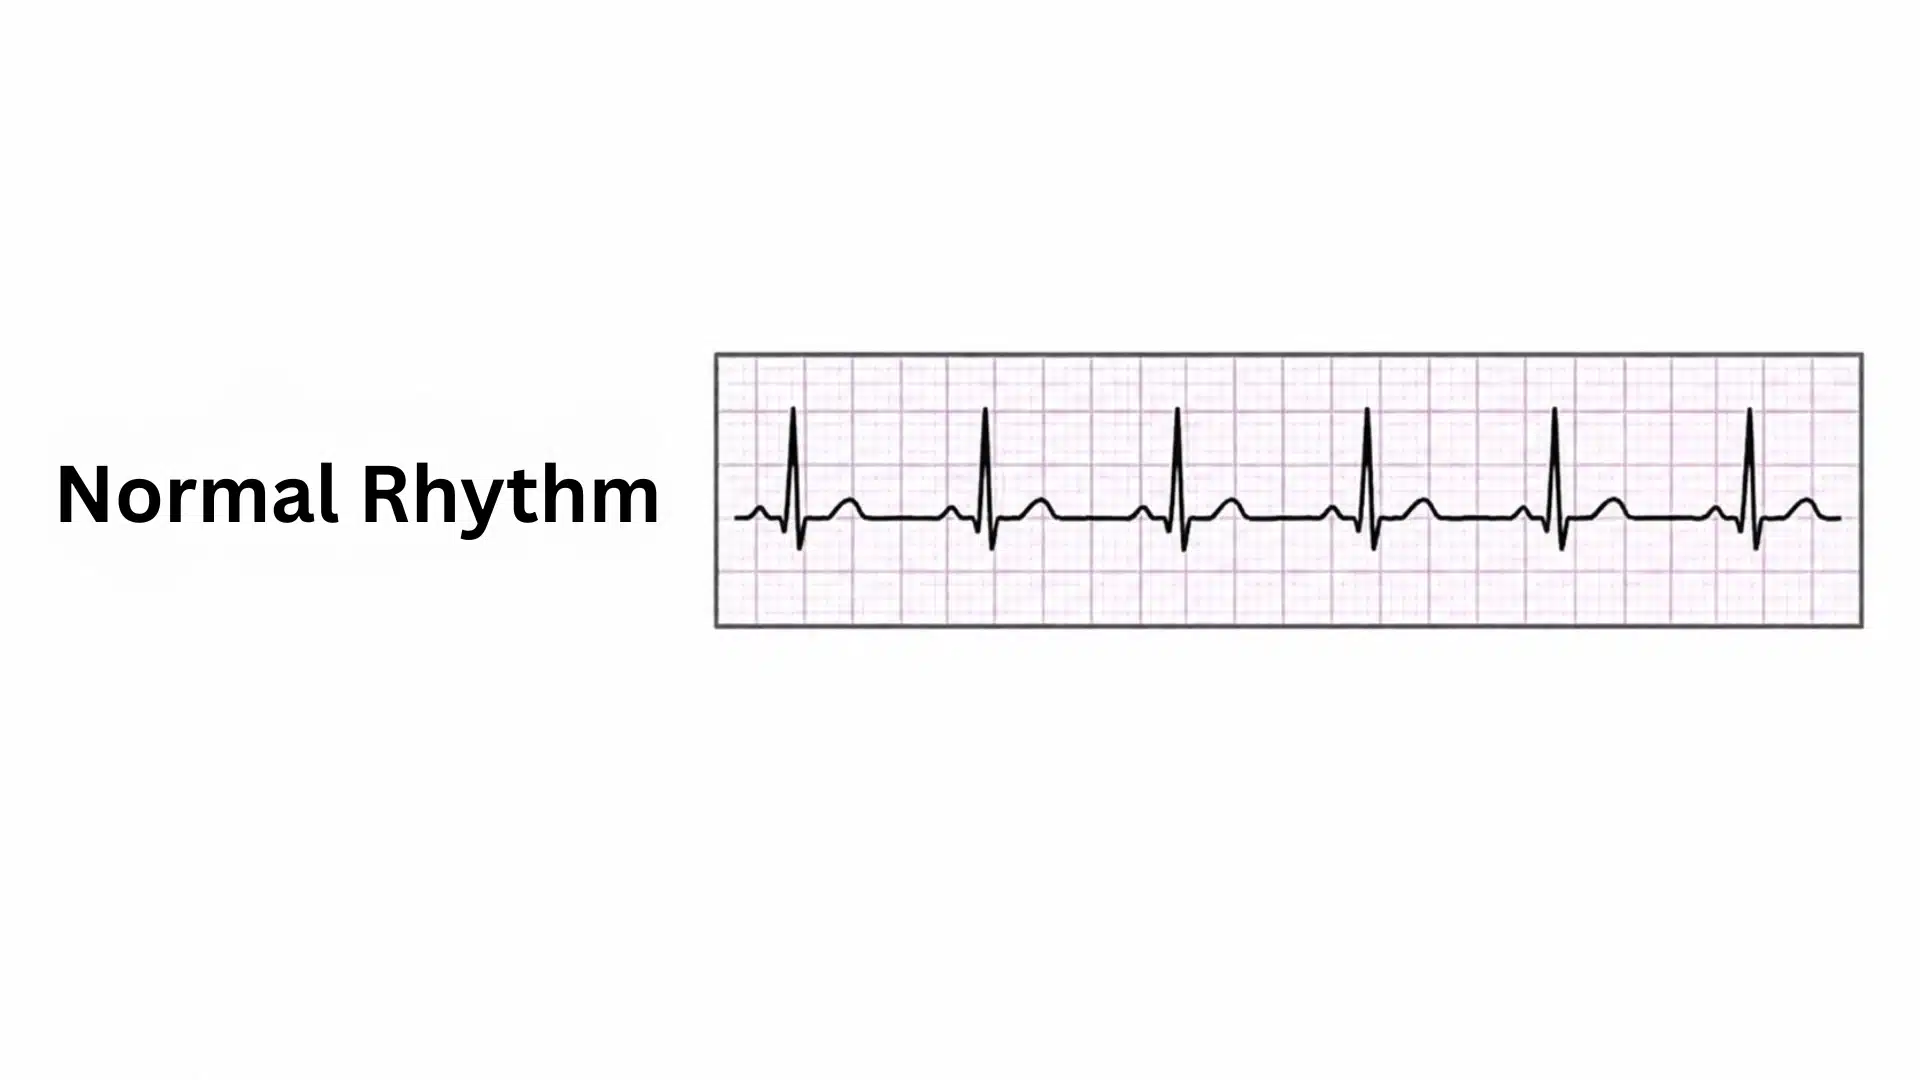
Normal sinus rhythm is the baseline against which every other rhythm is compared.
Rate falls between 60–100 bpm, with a regular rhythm throughout the strip. Each beat shows a P wave preceding every QRS complex, with a consistent PR interval (120–200 ms) and a normal, narrow QRS complex (80–100 ms).
This is what a healthy, properly conducting heart looks like at rest.
2. Sinus Bradycardia
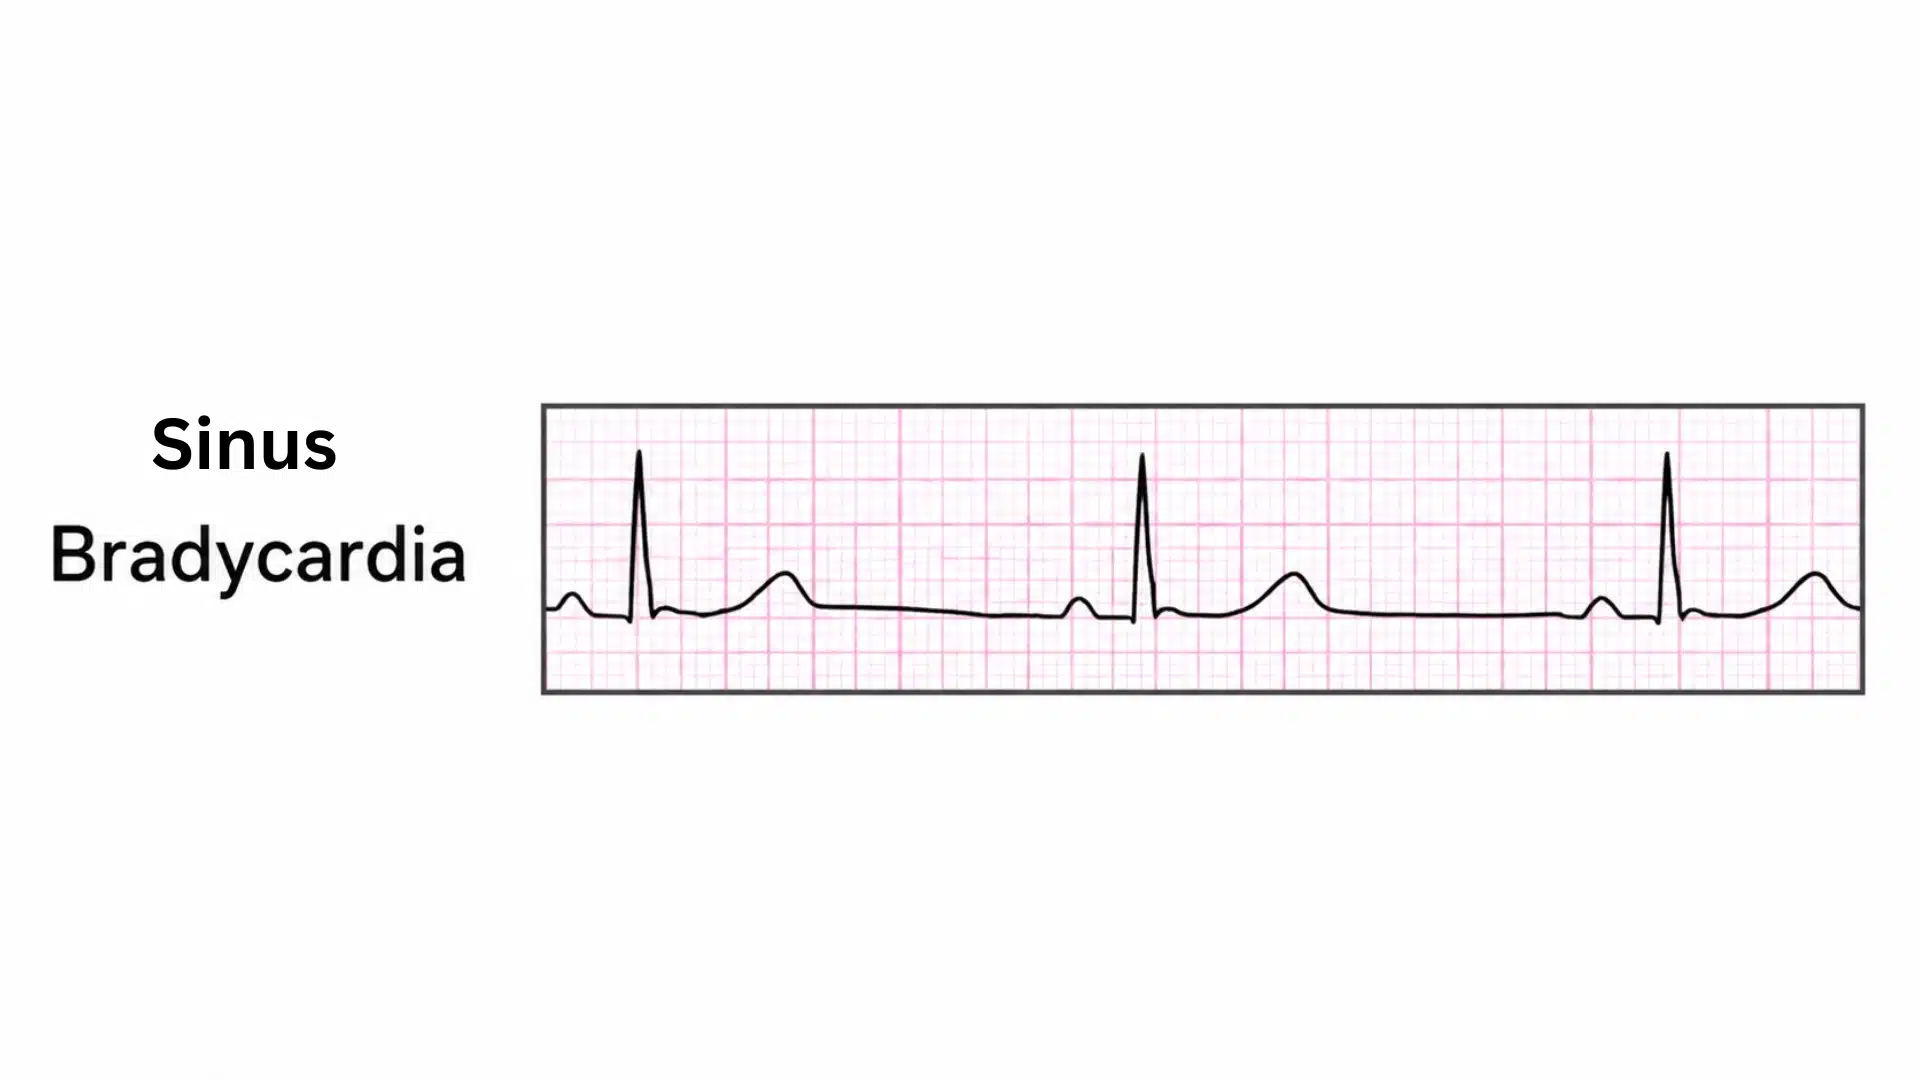
Sinus bradycardia describes a heart rate below 60 bpm that still meets all the normal sinus rhythm criteria: regular rhythm, a P wave before each QRS, and normal intervals.
Common causes include high fitness levels (a common, benign finding in trained athletes), certain medications like beta-blockers, hypothyroidism, or increased vagal tone.
It’s often normal and asymptomatic, though very low rates can sometimes cause dizziness or fatigue depending on the underlying cause.
3. Sinus Tachycardia
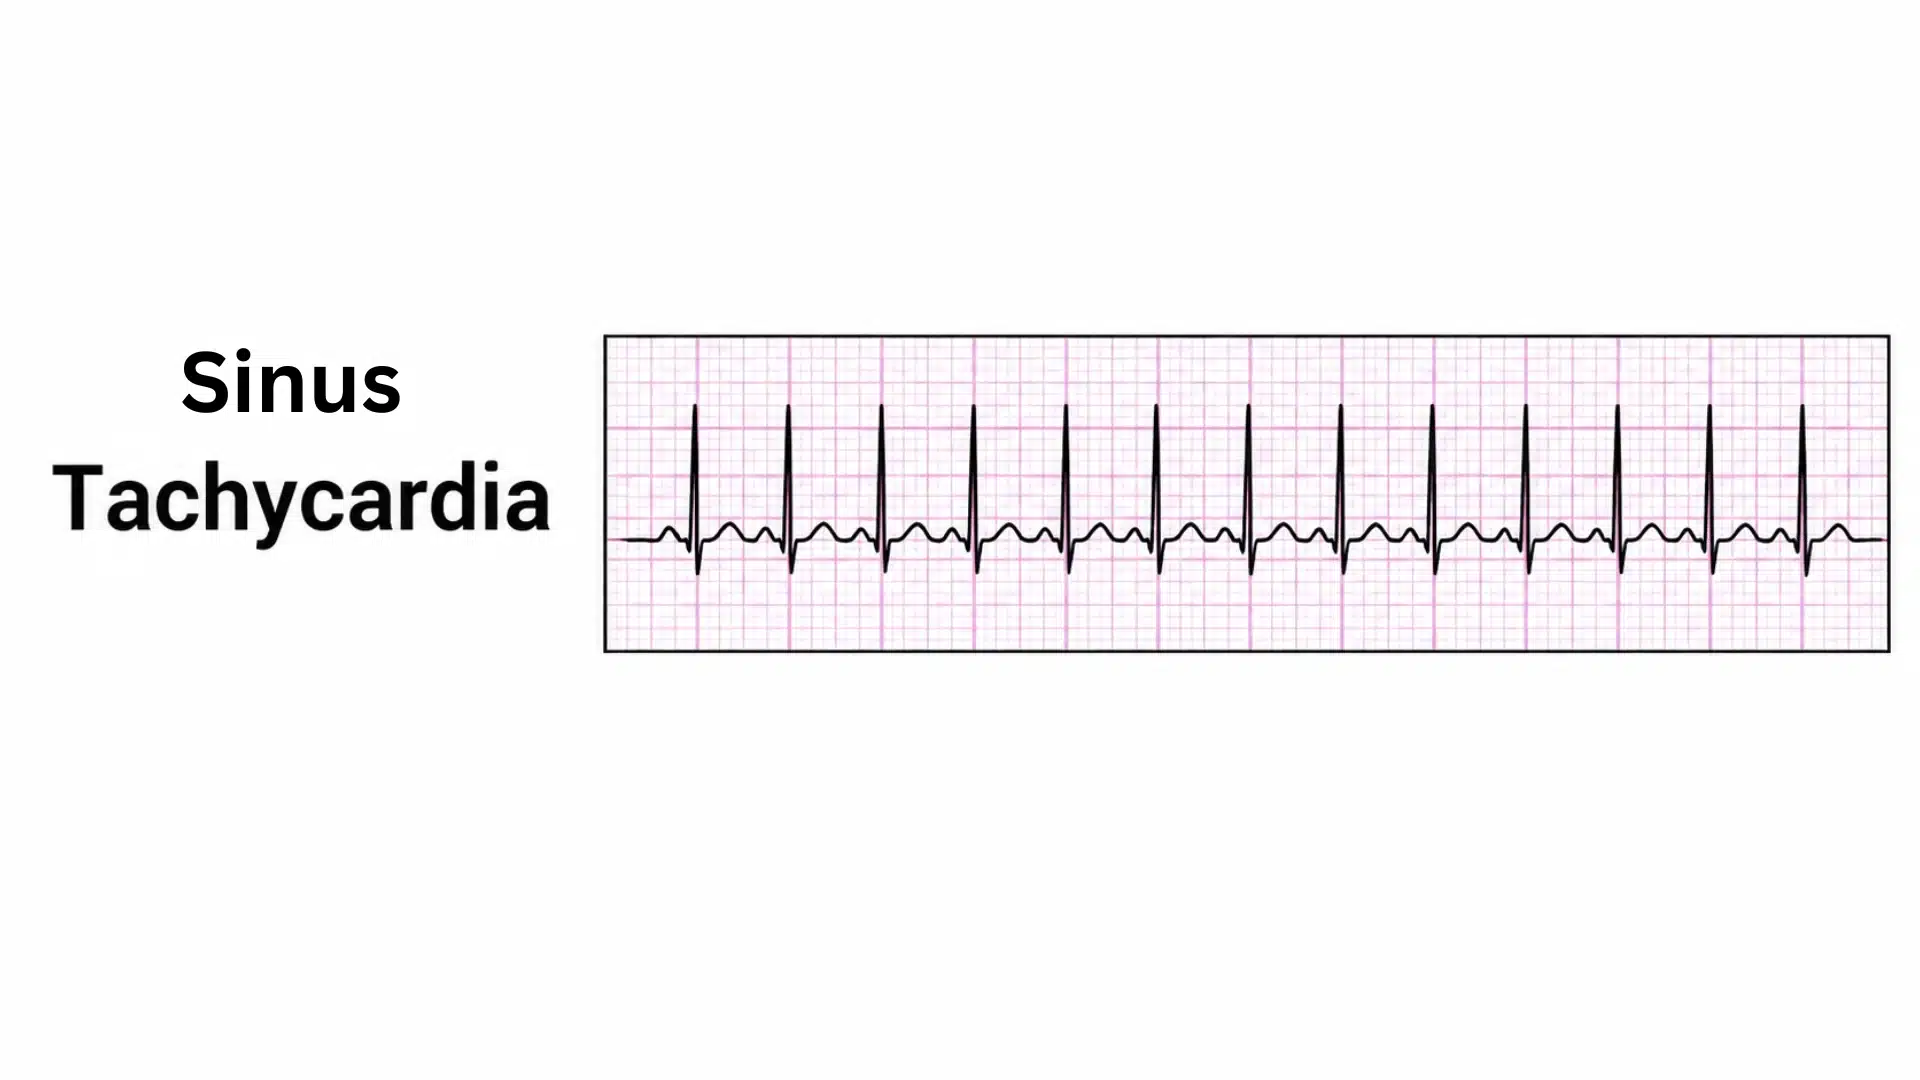
Sinus tachycardia is the same story in reverse: a heart rate above 100 bpm that still meets normal sinus criteria.
It’s frequently a physiological response rather than a primary heart problem; common causes include exercise, stress or anxiety, fever, pain, dehydration, or anemia.
Because it’s often secondary, addressing the underlying cause typically resolves the tachycardia rather than treating the heart rate itself.
4. Atrial Fibrillation
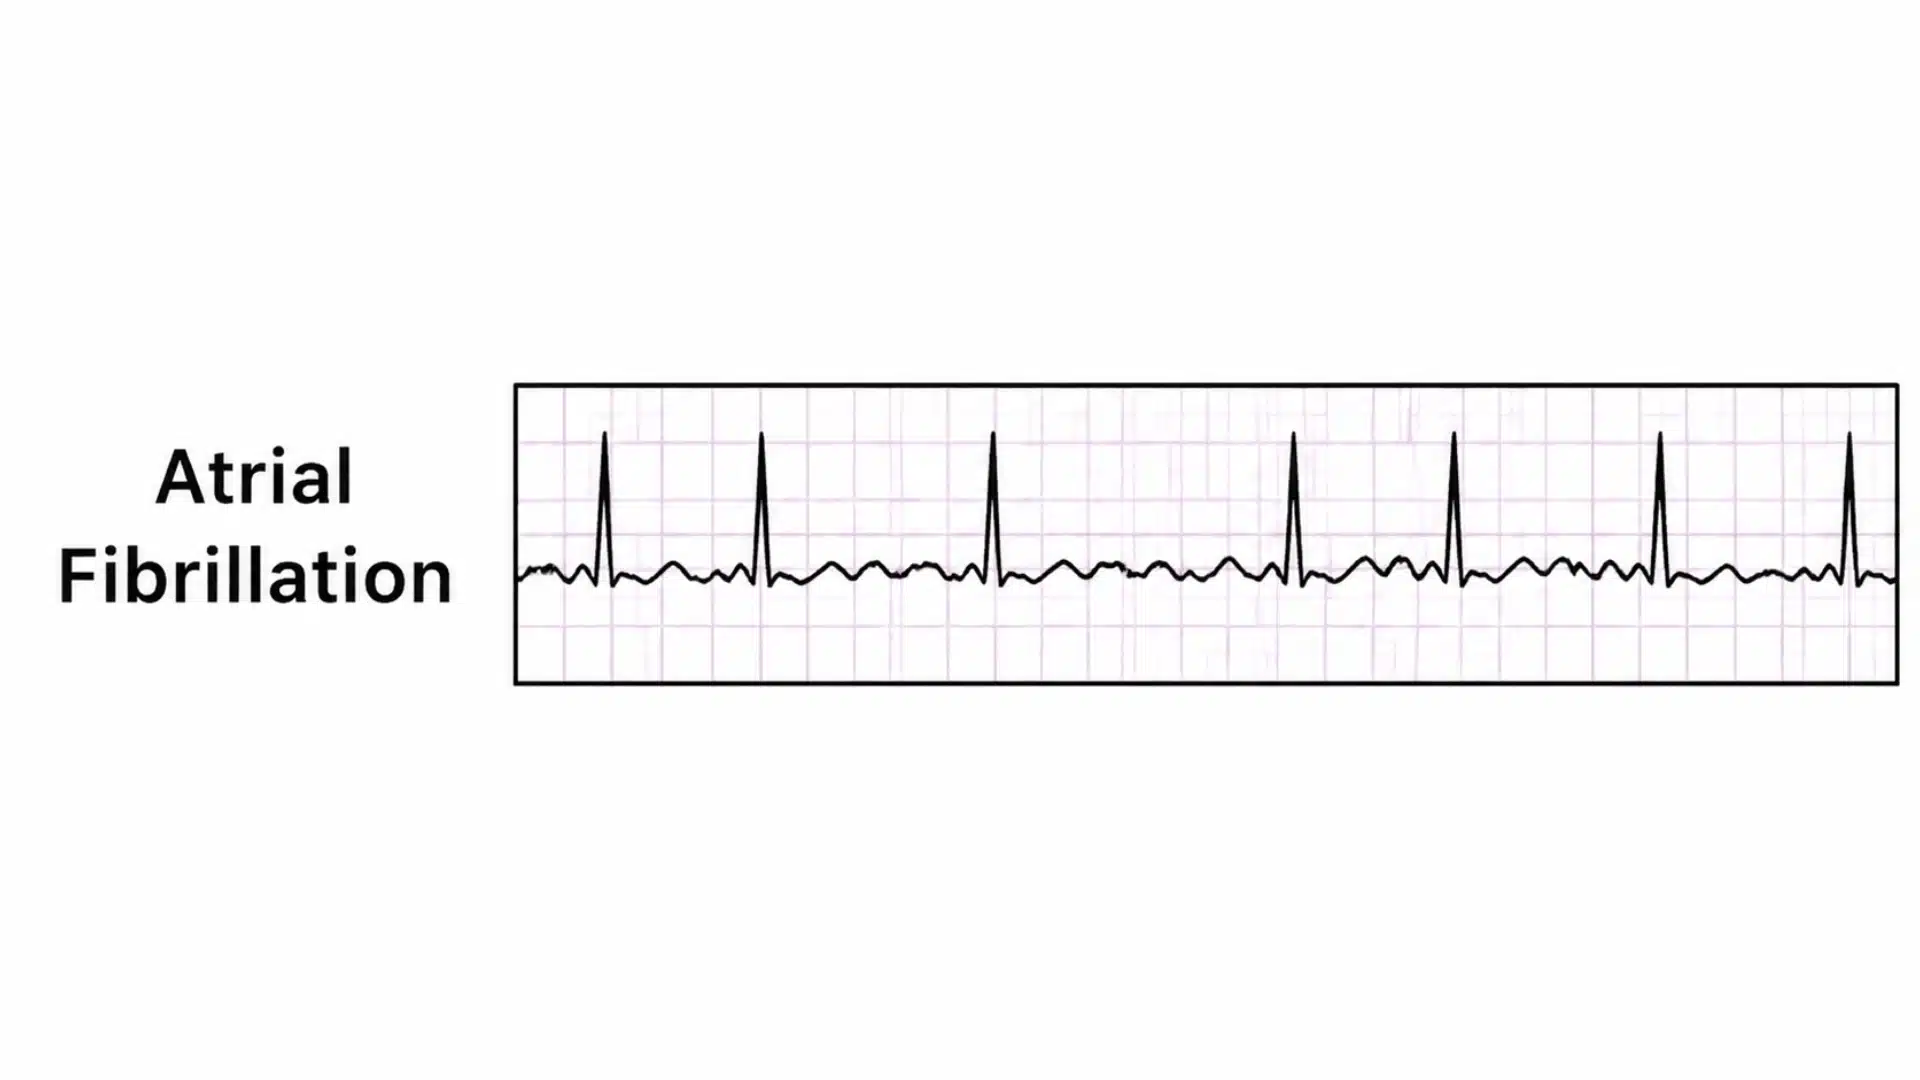
Atrial fibrillation is characterized by an irregularly irregular rhythm, with no discernible pattern to the R-R intervals at all.
Distinct P waves are absent, replaced instead by a chaotic, fibrillatory baseline. The ventricular response rate can vary widely depending on how many of the rapid atrial impulses actually make it through the AV node.
This is one of the most common arrhythmias encountered clinically and carries an increased risk of stroke due to blood pooling in the poorly contracting atria.
5. Atrial Flutter
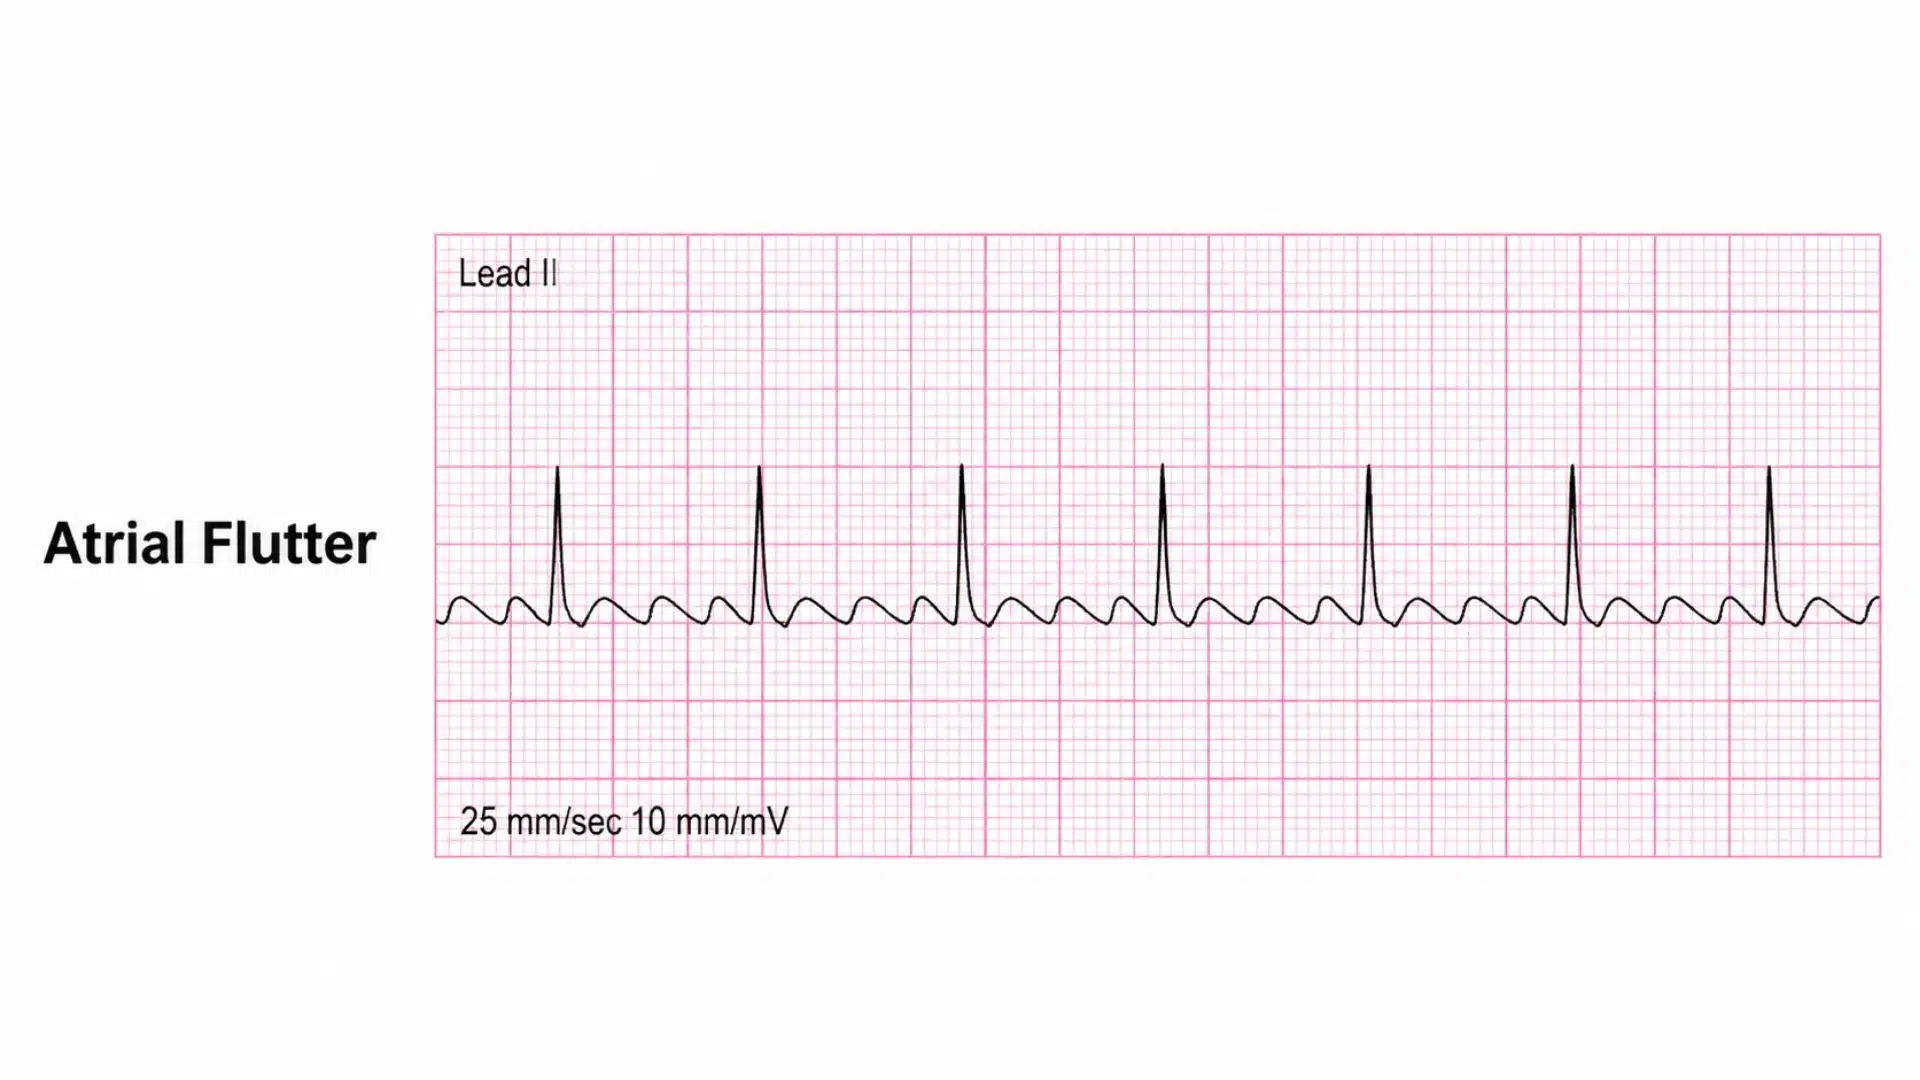
Atrial flutter shows a distinctive sawtooth pattern of flutter waves, reflecting organized (though abnormal) atrial electrical activity circling in a reentrant loop.
The atrial rate typically runs 250–350 bpm, but the AV node usually blocks a portion of these impulses, commonly resulting in a 2:1 conduction pattern that produces a ventricular rate around 150 bpm.
6. Ventricular Tachycardia
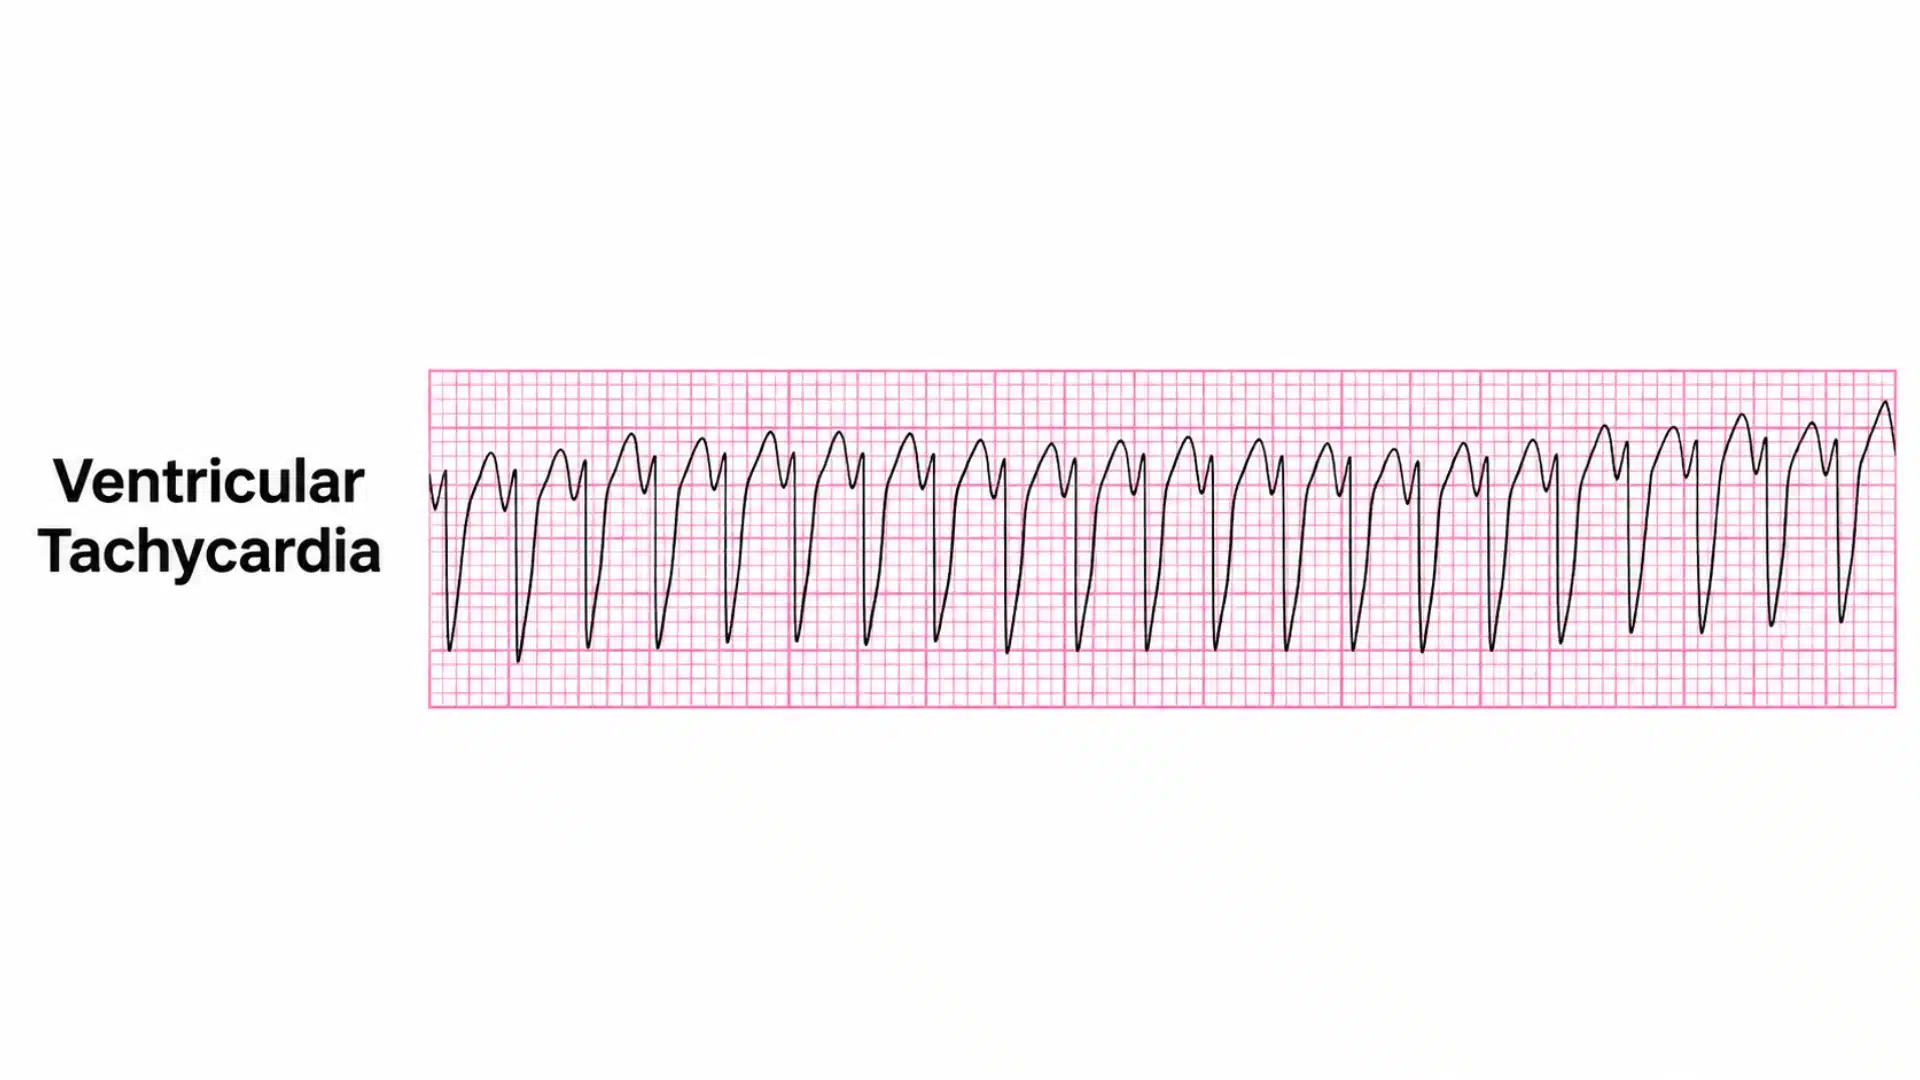
Ventricular tachycardia presents as a rapid, wide-complex rhythm originating from the ventricles, typically at a rate exceeding 100 bpm.
This rhythm carries real emergency significance, since it can be poorly tolerated hemodynamically and has the potential to deteriorate into ventricular fibrillation if not addressed promptly.
7. Ventricular Fibrillation
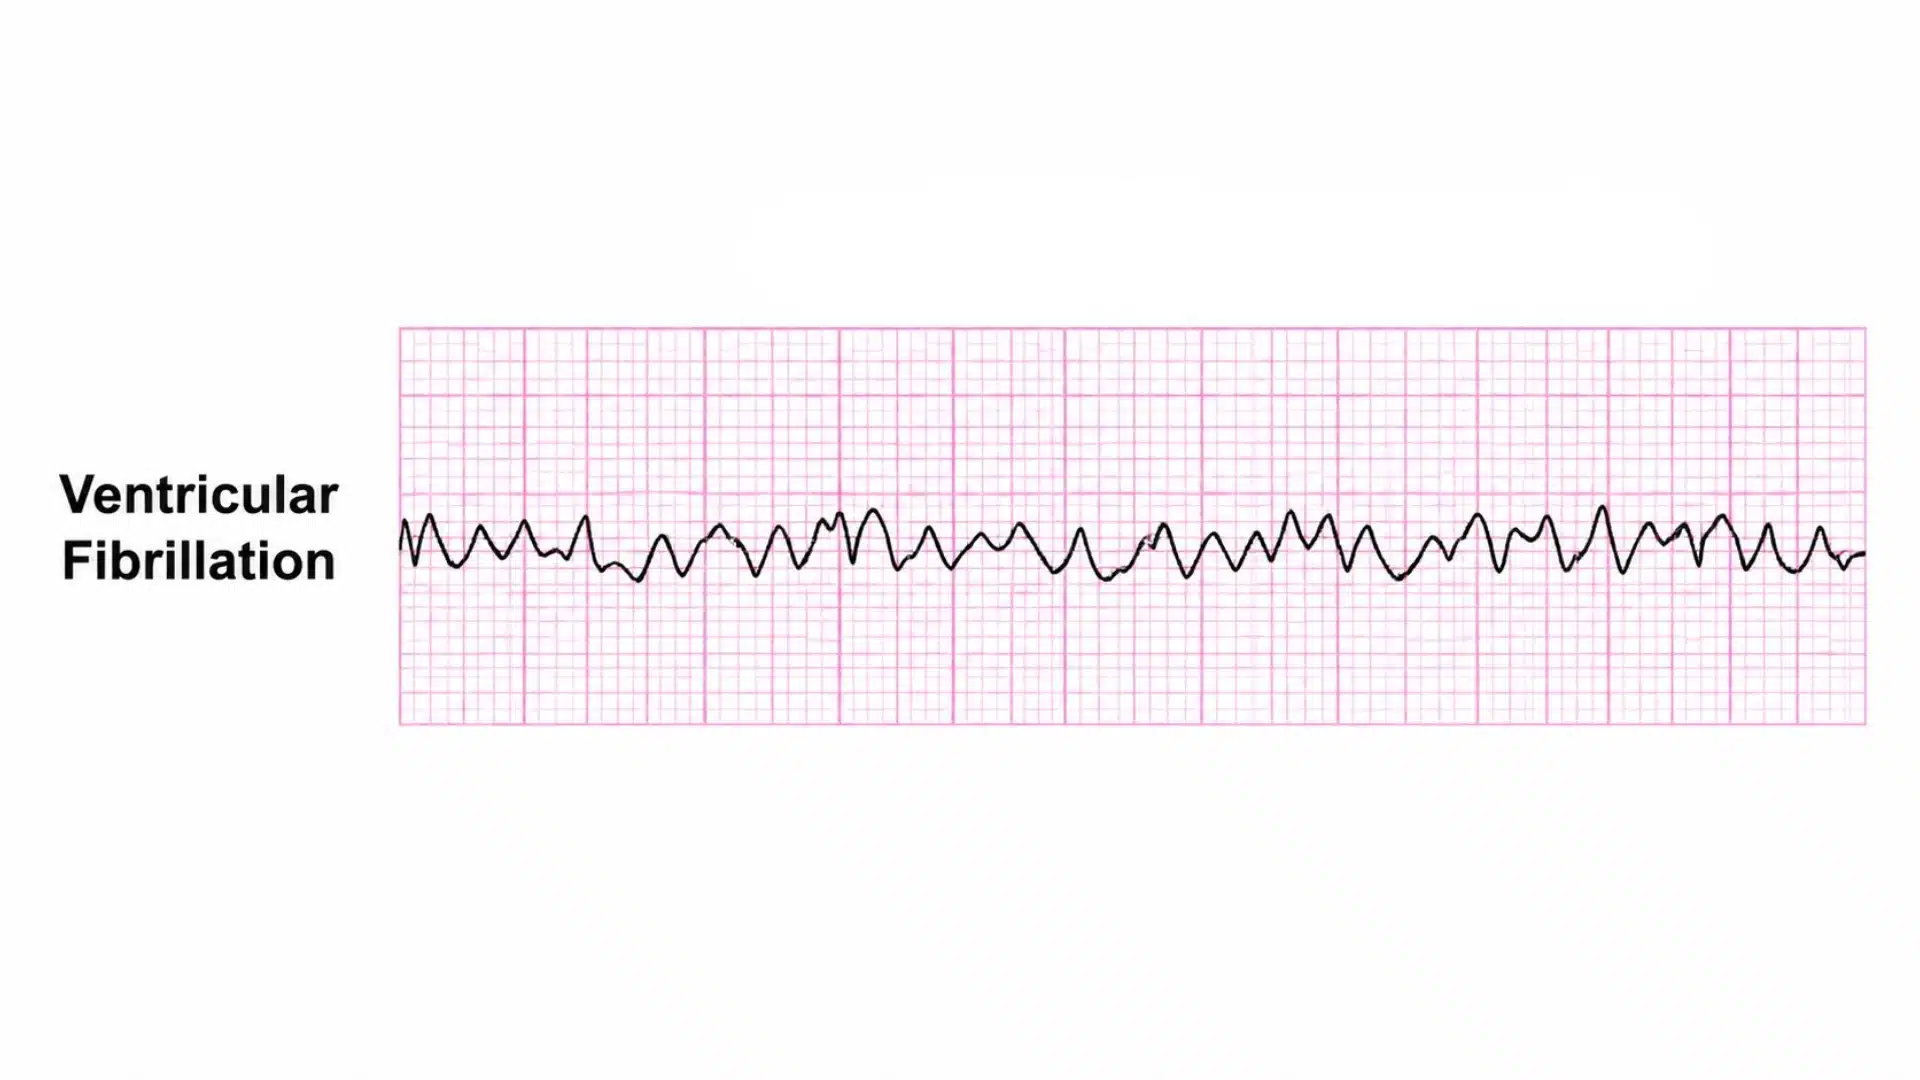
Ventricular fibrillation is chaotic, disorganized electrical activity with no identifiable P waves, QRS complexes, or organized rhythm whatsoever.
There’s no effective, coordinated ventricular contraction happening, which means no meaningful cardiac output.
This is a cardiac arrest rhythm requiring immediate emergency intervention.
Practice Test: EKG Strips With Answers: Ready to test what you’ve learned?
Work through each strip below using the method: rate, rhythm, P waves, PR interval, QRS, before checking your answer.
[Download the EKG strips Practice text here]
Note: These are simplified schematic illustrations for educational review, not actual patient tracings.
Heart Block Interpretation Cheat Sheet
How to recognize and distinguish the four major AV block types, from benign to urgent.
Block Type | Key Criteria | Significance |
|---|---|---|
First-Degree AV Block | PR > 200 ms; every P wave followed by a QRS | Often incidental, worth monitoring |
Mobitz Type I (Wenckebach) | PR progressively lengthens until a QRS drops | Generally benign; rarely progresses |
Mobitz Type II | PR stays constant; QRS drops without warning | Higher risk of progression |
Third-Degree (Complete) | Full AV dissociation; no P-QRS relationship | Serious; often needs a pacemaker |
Tips to Improve EKG Interpretation
Practical habits that turn slow, effortful reading into fast, confident interpretation over time.
Spend time reviewing normal sinus rhythm strips until the rate, spacing, P waves, and intervals become second nature.
Once “normal” is second nature, abnormalities stand out far more easily against that baseline.
Run through the same 7-step method on every strip, no matter how simple or obvious it looks.
Skipping steps “because it looks fine” is exactly how subtle findings get missed.
Place an abnormal rhythm side by side with a normal strip whenever possible; the direct contrast helps distinguishing features stick.
Frequently Asked Questions (FAQ’s)
What Are the 7 Steps of EKG Interpretation?
Check patient info and quality, calculate heart rate, determine rhythm regularity, analyze P waves, measure the PR interval, evaluate the QRS complex, and review the ST segment and T waves.
What is the Easiest Way to Read an EKG Strip?
Follow the same systematic 7-step sequence every time rather than jumping straight to pattern recognition; consistency builds accuracy and speed over time.
What Are Normal EKG Intervals?
PR interval: 120–200 ms, QRS duration: 80–100 ms, and QTc: roughly 350–450 ms (men) or 360–460 ms (women).
How Do You Calculate Heart Rate on an EKG?
Use the 300 method for regular rhythms (300 ÷ large boxes between R waves) or the 6-second method for irregular ones (QRS count × 10).
What Does a Wide QRS Complex Mean?
A QRS of 120 ms or more suggests a bundle branch block or a rhythm originating from the ventricles rather than normal conduction.
End Note!
A cheat sheet only helps if you actually run the steps every time, not just when a strip looks tricky.
Rate, rhythm, P waves, intervals, then ST and T. That order rarely fails, even on the strips that look messy at first glance.
Which rhythm gives you the most trouble right now?
Drop it in the comments; a specific rhythm is easier to break down than “EKGs in general,” and it might help another student reading through the same section.