

Choosing which AP exams to take feels oddly personal, almost like picking which version of yourself you want to challenge.
And somewhere in that process, most students find themselves down a rabbit hole of score breakdowns, pass rates, and class comparisons, trying to figure out what they are actually getting into.
AP Lang, AP Physics, and AP Stats tend to sit at the center of those conversations, each carrying its own reputation and its own story.
Year-to-year trends, honest comparisons, score interpretation, and everything else worth knowing about these exams get unpacked right here.
Breaking Down the AP Lang Pass Rate
AP Lang is one of the most widely taken AP exams, and its pass rate reflects that.
The overall pass rate (scoring a 3 or higher) landed at 54.6% in 2024, with a mean score of 2.79. In 2025, that number climbed noticeably, which signals a meaningful shift worth paying attention to.
| Year | Score 5 | Score 4 | Score 3 | Score 2 | Score 1 | Pass Rate (3+) | Mean Score |
|---|---|---|---|---|---|---|---|
| 2025 | 13.4% | 28.0% | 32.8% | 16.1% | 9.7% | 74.3% | 3.19 |
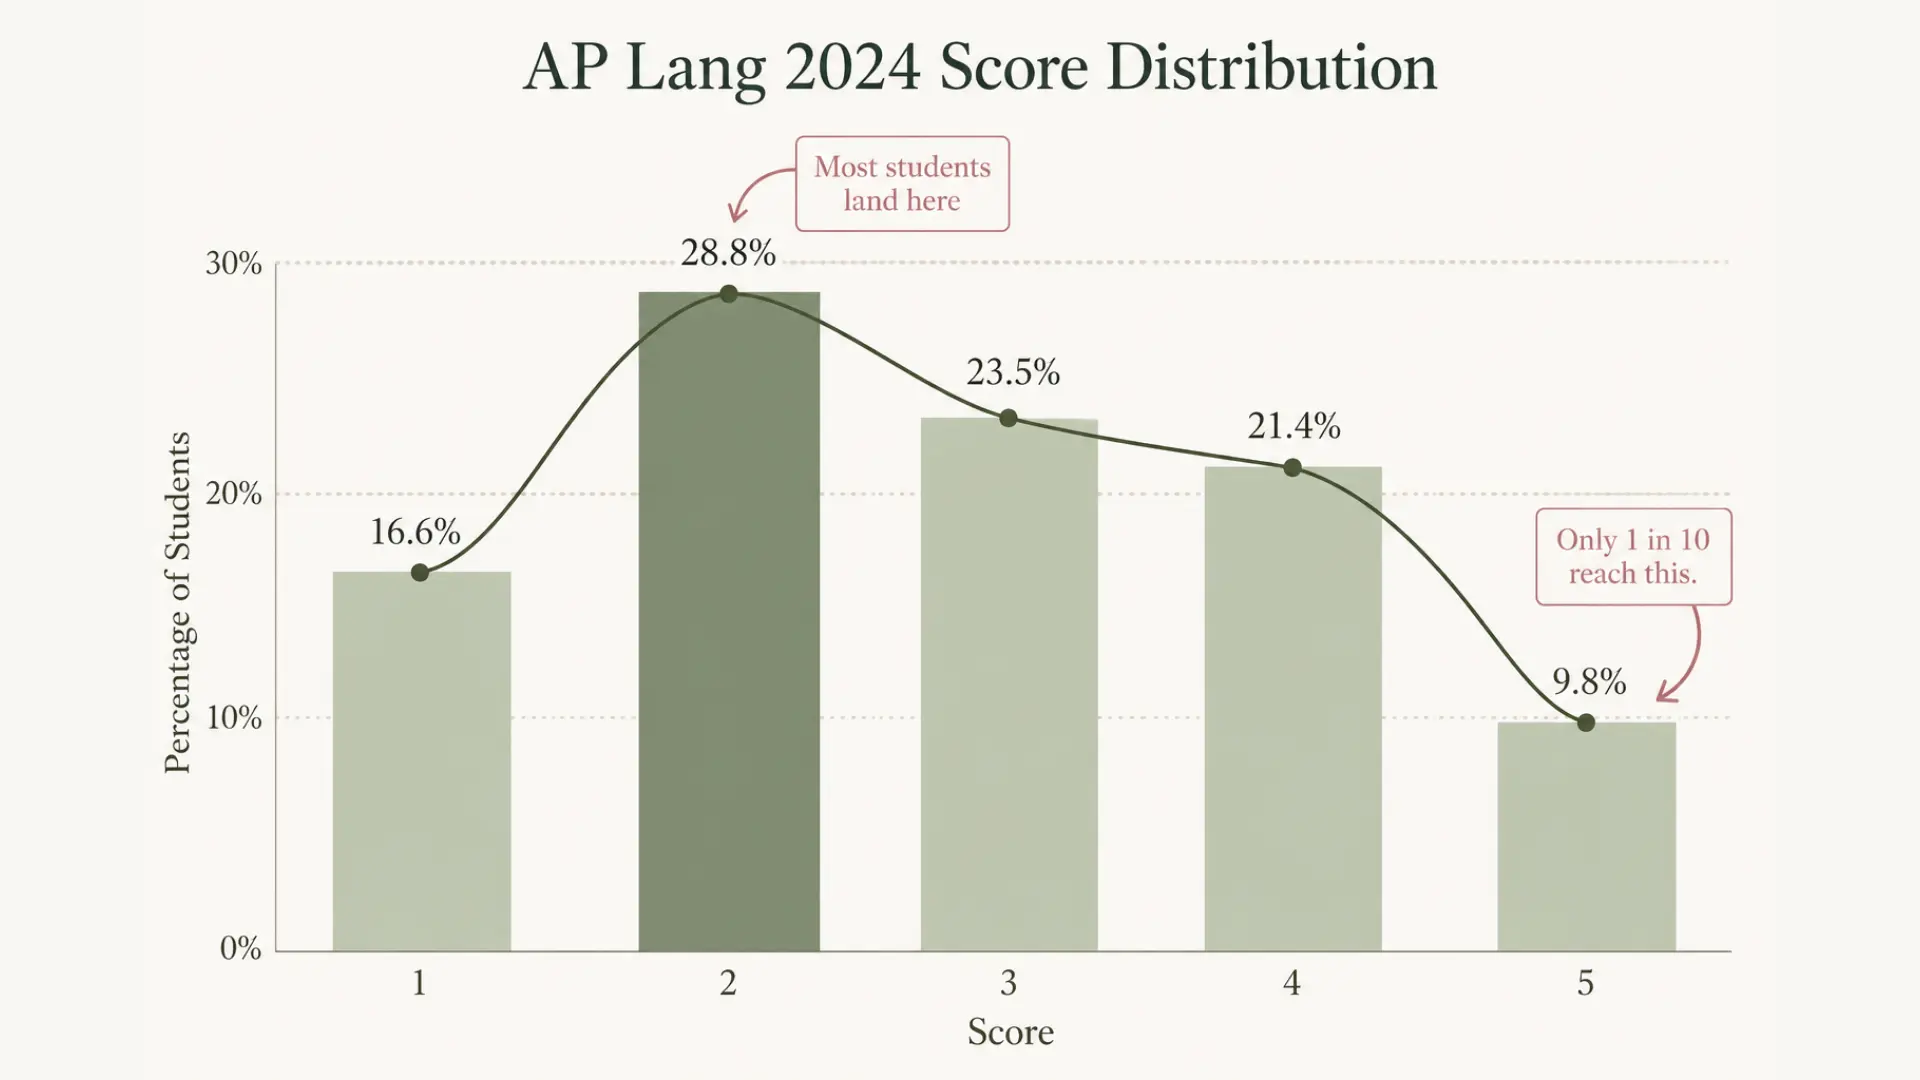
| 2024 | 9.8% | 21.4% | 23.5% | 28.8% | 16.6% | 54.6% | 2.79 |
| 2023 | 10.3% | 19.7% | 26.1% | 29.5% | 14.4% | 56.1% | 2.82 |
| 2022 | 10.4% | 21.1% | 24.2% | 29.8% | 14.5% | 55.7% | 2.86 |
| 2021 | 9.1% | 22.9% | 25.8% | 29.3% | 12.9% | 57.7% | 2.86 |
| 2020 | 12.6% | 20.4% | 29.1% | 26.2% | 11.8% | 62.1% | 2.96 |
| 2019 | 9.9% | 18.2% | 26.2% | 31.2% | 14.5% | 54.3% | 2.78 |
| 2018 | 10.6% | 17.7% | 28.8% | 29.3% | 13.5% | 57.2% | 2.83 |
What makes AP Lang genuinely hard is not one single thing. It is the combination of timed rhetorical analysis, synthesis essay pressure, and argument writing all landing in the same sitting.
Students often underestimate how much reading stamina the exam actually demands.
When placed next to AP Literature, AP Lang consistently scores lower. AP Lit held a pass rate of around 72% in 2024, compared to AP Lang’s 54.6%. A big part of that gap comes down to pool size.
AP Lang draws from an enormous, varied test-taking population, which naturally spreads scores wider.
AP Lang Score Distribution Explained
Knowing your score is one thing; understanding what it actually reflects is another.
Here is a closer look at how AP Lang scores are structured, calculated, and interpreted across different college contexts.
What Does the AP Lang Score Curve Look Like?
The AP Lang score distribution does not follow a neat bell curve. Scores cluster heavily around 2 and 3, with a noticeably thin top end.
Only around 9.8% of students earned a 5 in 2024, which is considerably lower than many STEM-based AP exams, where high scorers are more concentrated.
The large and varied test-taking pool naturally flattens the upper end of the distribution in a way that subject-specific exams simply do not.
How AP Lang is Scored?
The exam runs across two sections. Section I is 45 multiple-choice questions worth 45% of the total score, and Section II has three essays scored 0 to 6 each, carrying the remaining 55%.
The three essay types are synthesis, rhetorical analysis, and argument.
| Section | Format | Weight |
|---|---|---|
| Multiple Choice | 45 questions, 1 hour | 45% |
| Synthesis Essay | Document-based writing | ~18% |
| Rhetorical Analysis Essay | Nonfiction text analysis | ~18% |
| Argument Essay | Evidence-based writing | ~18% |
Since essays carry the majority of the weight, writing skill is ultimately where the AP Lang score is made or lost, not the multiple-choice section.
What Counts as a “Good” AP Lang Score?
The honest answer is that it depends on where you are headed.
- Score of 3 meets the minimum passing threshold and earns credit at most colleges and state universities.
- Score of 4 is widely considered strong. Most competitive schools grant credit or placement at this level.
- Score of 5 is the target for selective admissions. Most Ivy League schools require at least a 4, and sometimes a 5, to award college credit, with policies varying by department. Yale, for instance, grants AP Lang credit only for a score of 5.
AP Physics Pass Rate Breakdown
Not all AP Physics exams are created equal, and the pass rates make that very clear.
Where you land depends heavily on which version you sit for and how well the course’s demands match your strengths.
AP Physics 1 vs. AP Physics 2 Pass Rate
In 2024, AP Physics 1 had a pass rate of just 47.3% with a mean score of 2.59, while AP Physics 2 came in considerably higher at 70.5% with a mean of 3.20. The gap is not a coincidence.
Physics 1 draws a much larger and more varied pool of test-takers, many of whom encounter college-level physics reasoning for the first time.
Physics 2 students, having already cleared Physics 1, tend to arrive better prepared for the conceptual depth the exam demands.
| Exam | 2024 Pass Rate (3+) | Mean Score |
|---|---|---|
| AP Physics 1 | 47.3% | 2.59 |
| AP Physics 2 | 70.5% | 3.20 |
| AP Physics C: Mechanics | 76.3% | — |
| AP Physics C: E&M | 71.6% | 3.53 |
AP Physics C Pass Rates Compared
AP Physics C tells a different story altogether.
AP Physics C: Mechanics had a pass rate of 76.3% in 2024, and AP Physics C: E&M saw 35.2% of students earn a 5, with 71.6% passing overall.
These numbers look strong on paper, but they are largely a reflection of who takes these exams.
The high pass rate does not mean the exam is easier; Physics C attracts students already taking calculus-based coursework, which naturally skews the pool toward stronger performers.
AP Stats Score Distribution and Pass Rate
AP Statistics has a reputation for being the approachable math AP, but the score data tells a more complicated story.
Here is what the numbers actually look like and how they stack up against the calculus exams.
Latest AP Statistics Score Distribution
In 2024, a total of 252,914 students sat for the AP Statistics exam, with 61.8% earning a passing score of 3 or higher and a mean score of 2.96.
What stands out in the distribution is the unusually high share of 1s, which has held persistently high across years.
Students often enter the exam underestimating how precisely they need to communicate statistical reasoning in writing, and that is where scores tend to slip.
| Score | 2024 | 2023 | 2022 |
|---|---|---|---|
| 5 | 17.5% | 15.1% | 14.8% |
| 4 | 21.8% | 22.2% | 22.2% |
| 3 | 22.5% | 22.7% | 23.4% |
| 2 | 15.9% | 16.2% | 16.5% |
| 1 | 22.3% | 23.8% | 23.1% |
| Pass Rate (3+) | 61.8% | 60.0% | 60.4% |
AP Stats vs. Calculus AP Exams
Placed side by side, the three math-heavy AP exams reveal a clear performance gap. AP Stats and Calc AB sit in a similar range, while Calc BC consistently outperforms both.
| Exam | 2024 Pass Rate (3+) | Score 5 Rate | Mean Score |
|---|---|---|---|
| AP Statistics | 61.8% | 17.5% | 2.96 |
| AP Calculus AB | 58.0% | — | 2.99 |
| AP Calculus BC | 80.9% | 45% | 3.75 |
Calc BC’s remarkably high 5 rate comes down to who takes it. The exam draws students who have already cleared Calc AB, making it a self-selected, stronger pool from the start.
AP Stats, by contrast, attracts a broader range of students, many of whom find out mid-exam that interpreting probability and inference in full sentences is harder than any formula.
Comparing AP Exam Pass Rates Across Subjects
Pass rates look very different depending on which exam you are looking at, and a lot of that comes down to who is sitting in the room.
Subject difficulty, student self-selection, native language advantage, and pool size all shape the numbers in ways that a single percentage cannot fully capture.
| Exam | 2024 Pass Rate (3+) | Score 5 Rate | Key Note |
|---|---|---|---|
| AP Chinese Language | ~89% | High | Native speaker advantage |
| AP Research | ~88.5% | Moderate | Self-selected, motivated pool |
| AP Spanish Language | ~85% | Moderate | Heritage speaker skew |
| AP Calculus BC | 80.9% | 45% | Pre-filtered by Calc AB |
| AP Statistics | 61.8% | 17.5% | Broad, mixed-preparedness pool |
| AP Calculus AB | 58.0% | ~20% | Wider student population |
| AP English Language | 54.6% | 9.8% | Largest, most varied pool |
| AP Physics 1 | 47.3% | 10.2% | Lowest pass rate of any AP |
The pattern across this table is consistent: high pass rates often reflect who shows up, not just how hard the content is.
Chinese, Calculus BC, and Physics C all carry reputations for being genuinely difficult, yet their pass rates sit well above average precisely because of who chooses to take them.
Reading these numbers without that context gives a distorted picture of where the real challenge lies.
How to Interpret AP Pass Rates Correctly?
A pass rate tells you how many students crossed the finish line, but it says almost nothing about how hard the race actually was.
Who takes an exam shapes its numbers just as much as the exam itself. Calculus BC’s 80% pass rate reflects a filtered pool, not an easy test.
The 5-rate often reveals more, showing how many students genuinely mastered the material rather than barely cleared it.
Course fit, genuine interest, teacher quality, and consistent study habits will move your score far more than picking an exam based purely on its pass rate.
Expert Tips to Improve Your AP Exam Score
Scoring higher on any AP exam comes down to practicing the right things, not just practicing more.
Here is what actually moves the needle across AP Lang, Physics, and Stats.
AP Lang
- Practice timed essays regularly, treating every attempt as exam conditions
- Build a rhetorical analysis framework and apply it to new passages weekly
- Annotate actively while reading, not just highlighting
AP Physics
- Drill formula application through FRQ problems, not just concept review
- Practice explaining your reasoning in writing, since graders reward process over answer
AP Statistics
- Interpret graphs and data outputs in full sentences, the way the exam demands
- Memorize inference conditions cold before sitting for the exam
- Work through probability problems slowly; rushing is where most points slip
The students who improve most are the ones who treat weak spots as the actual syllabus. Find what is costing you points and work backwards from there.
What AP Score Distributions Reveal About College Readiness?
AP scores give colleges a standardized signal of how prepared a student is for college-level work, but admissions officers read far more into the course selection than the score itself.
Choosing rigorous APs matters more than avoiding hard ones. A 3 in AP Physics carries more weight than a 5 in an easier elective at many selective schools.
Holistic review means grades, essays, and course load all factor in together.
Students who pick APs aligned with genuine interest and academic strengths tend to perform better and build stronger, more coherent applications in the process.
Final Thoughts
Understanding the ap lang pass rate, or any AP pass rate for that matter, is only useful when you know how to read it in context.
The numbers are a starting point, not a verdict on your potential.
Every score distribution has a story behind it, shaped by who took the exam, how they prepared, and what the subject demands. Pick your exams with intention, study what actually trips students up, and trust the process.
Your score is one data point in a much bigger picture.
What AP exam are you preparing for? Drop it in the comments!
Frequently Asked Questions (FAQs)
What is a Good AP Score?
A score of 3 is considered passing and earns college credit at most schools. Selective universities often require a 4 or 5. What counts as a good score ultimately depends on the credit policy of the specific college you are applying to.
What is the Passing Rate for Ap Lang?
In 2024, 54.6% of students passed AP Lang with a score of 3 or higher. In 2025, that number jumped significantly to 74.3%, largely driven by the shift to digital testing and a revised exam format.
Is AP Statistics Harder than AP Lang?
Based on pass rates alone, AP Statistics and AP Lang sit close together in difficulty. In 2025, AP Lang had a 74.3% pass rate, while AP Statistics had a 60.3% pass rate.