



Lab values in nursing charts list the normal ranges nurses check on every shift. Each value points to a specific part of a patient’s body. A blood count shows infection or bleeding risk.
A metabolic panel shows kidney stress or fluid balance. Knowing these ranges helps you spot problems early. This breakdown covers the major panels nurses use daily.
It explains what each value measures and what it means. It also shows what a high or low result usually points to.
Once you learn the pattern, reading labs becomes simple. Clear numbers make for clear decisions at the bedside.
Why Lab Values Matter in Nursing
Lab values matter in nursing because they give a clear picture of what is happening inside a patient’s body.
Nurses use these results to spot problems early, track changes, and understand how well treatments are working for the patients.
A high or low result can point to issues with hydration, infection, kidney function, blood sugar, electrolytes, or other body systems. Nurses also compare current results with earlier tests to notice important trends.
Lab values are never viewed alone. They are checked along with symptoms, vital signs, medications, and the patient’s overall condition.
Complete Blood Count (CBC) Lab Values

A complete blood count is one of the most common lab panels and shows blood health in one draw. Each value below carries its own meaning and action worth a closer look:
1. White Blood Cell Count (WBC)
Normal WBC falls between 4,000 and 10,000 per mm³.
An elevated count often points to infection, inflammation, or stress on the body, while a low count can signal bone marrow suppression or immunosuppression from chemotherapy or certain medications.
Nurses use this value to guide infection precautions and to flag patients at higher risk for complications.
A markedly low WBC calls for neutropenic precautions and close monitoring for fever.
2. White Blood Cell Differential
These five values form the WBC differential, breaking total white cells into types nurses read together, since each shifts distinctly with infection or allergy:
Cell Type | Normal Range | Low Suggests | High Suggests | Nursing Note |
Neutrophils | 46 – 78% | Immunosuppression risk | Bacterial infection | Watch for neutropenia |
Lymphocytes | 18 – 52% | Immune suppression | Viral infection | Correlate with symptoms |
Monocytes | 3 – 10% | Rarely significant | Chronic infection | Trend over time |
Eosinophils | 0 – 6% | Rarely significant | Allergy or parasites | Ask about allergies |
Basophils | 0 – 3% | Rarely significant | Allergic reaction | Monitor for anaphylaxis |
Together, these values explain why the WBC total changed, and by how much each type shifted.
3. Platelets
Normal platelet count falls between 150,000 and 400,000 per mm³.
A low count raises bleeding risk and calls for bleeding precautions, careful handling during procedures, and close monitoring for bruising or blood in stool or urine.
A high count raises clotting risk instead. Nurses check platelet trends before invasive procedures and flag any rapid drop to the provider right away.
4. Red Blood Cell Count (RBC)
Normal red blood cell counts are not identical for men and women, so nurses always check a result against the range that matches the patient:
Category | Range or Finding | Clinical Note |
Male RBC | 4.50 – 5.90 million/mm3 | Testosterone drives higher red cell output |
Female RBC | 4.00 – 5.20 million/mm3 | Monthly blood loss lowers baseline count |
Low RBC | Below normal range | Points to anemia, poor nutrition, chronic disease |
High RBC | Above normal range | Points to polycythemia or dehydration |
Nurses read RBC alongside hemoglobin and hematocrit rather than treating any single number as the full image.
5. Hemoglobin (Hgb)
- Male Normal range: 13 to 17 g/dL
- Female Normal range: 12 to 15 g/dL
- Around 7 g/dL is a common transfusion threshold
A drop in hemoglobin can appear before a patient looks pale or reports fatigue, which is why trending this value matters more than a single reading.
Transfusion decisions are rarely based on the number alone. Pair hemoglobin with heart rate, blood pressure, and how the patient actually looks and feels.
6. Hematocrit (Hct)
Hematocrit measures red cell volume, and this number can sanity-check hemoglobin:
Category | Range or Finding | Clinical Note |
Male Hct | 40 to 52 percent | Roughly three times the hemoglobin value |
Female Hct | 36 to 47 percent | Same three-times relationship applies |
Falls with Hgb | Both drop together | Often indicates active blood loss |
Rises alone | Hct up, Hgb steady | Often indicates dehydration, not true excess |
This is also known as the rule of three; mismatched results warrant checking fluid intake and bleeding history.
7. Mean Corpuscular Volume (MCV)
- Normal MCV ranges from 80 to 100 fL.
- Low MCV: Microcytic anemia, often from iron deficiency.
- High MCV: Macrocytic anemia, often from B12 or folate deficiency.
Mean corpuscular volume describes the average size of a red blood cell. This single value is often the first clue to what kind of anemia a patient has.
Nurses use this classification as the first clue when narrowing down an anemia’s cause, since it points toward which follow-up labs the provider is likely to order next.
8. Mean Corpuscular Hemoglobin (MCH) and Mean Corpuscular Hemoglobin Concentration (MCHC)
MCH normally falls between 0.4 and 0.5 fmol per cell and shows the average hemoglobin amount inside a single red blood cell, adding detail beyond cell size alone.
MCHC normally ranges from 30 to 35 g/dL and reflects how concentrated that hemoglobin is per cell.
A low MCHC often accompanies iron deficiency anemia, while a high MCHC can point to hereditary spherocytosis. Nurses read both alongside MCV for a fuller picture.
Basic Metabolic Panel (BMP) Lab Values
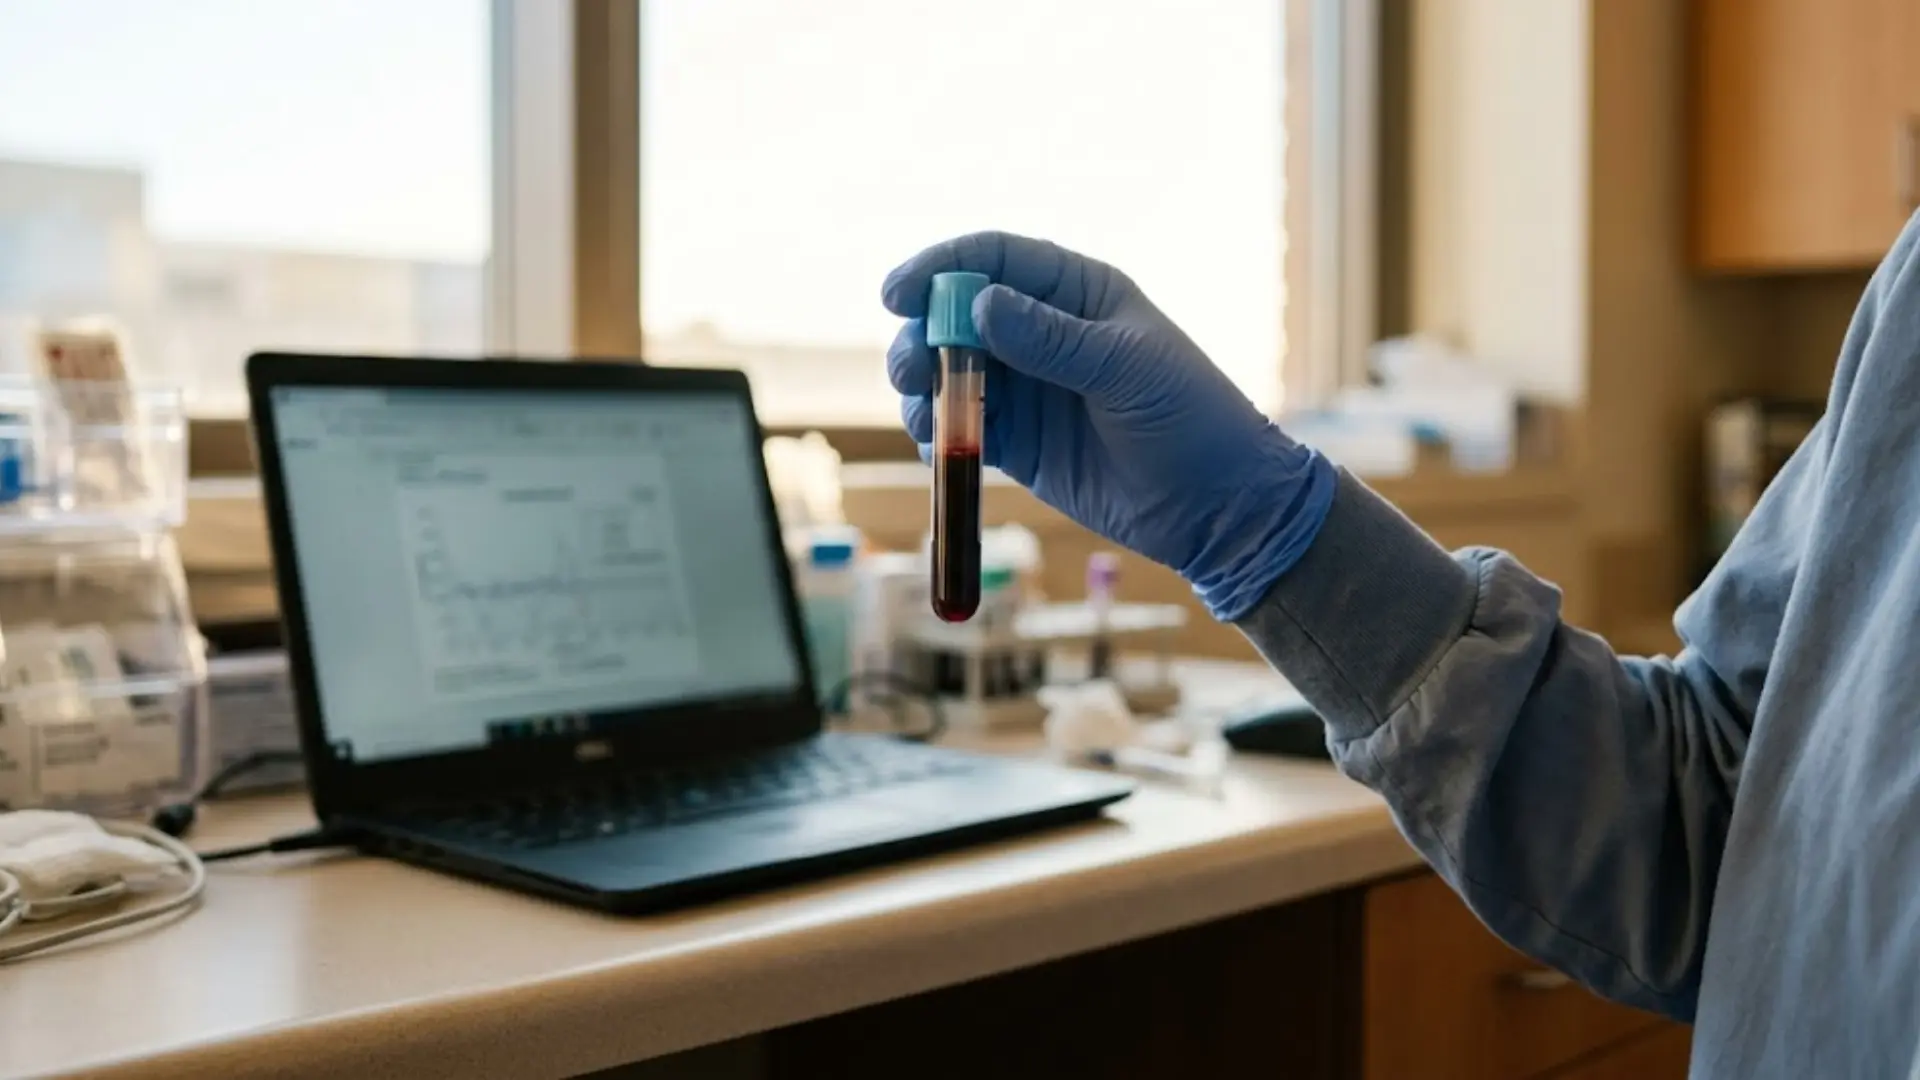
A basic metabolic panel measures key electrolytes, kidney markers, and blood sugar levels in a single draw. Nurses and doctors rely on these values to catch fluid imbalances or kidney stress early.
9. Sodium (Na)
Sodium controls fluid balance and nerve signaling throughout the body.
Levels outside the normal range can affect brain function fast, especially in older patients or those on IV fluids. Nurses track sodium closely during fluid therapy and diuretic use.
- Normal range: 135-145 mmol/L
- Low suggests: Dehydration, fluid overload.
- High suggests: Excess salt, water loss.
10. Potassium (K)
Potassium regulates muscle contraction and heart rhythm, making it one of the most closely watched BMP values. Small shifts can trigger dangerous arrhythmias within minutes.
Any abnormal reading calls for an immediate ECG check and prompt physician notification during patient monitoring.
- Normal range: 3.5-5 mmol/L
- Low suggests: Vomiting, diuretic use.
- High suggests: Kidney failure, tissue damage.
11. Chloride (Cl)
Chloride works alongside sodium to maintain fluid balance and support blood pH.
Its levels typically shift in the same direction as sodium during illness or fluid loss. Nurses check chloride alongside sodium readings to build a fuller fluid-status image during assessment.
- Normal range: 95-105 mmol/L
- Low suggests: Vomiting, gastric suctioning.
- High suggests: Dehydration, diarrhea.
12. Bicarbonate (CO₂)
Bicarbonate reflects the body’s acid-base balance and works to buffer excess acid in the bloodstream.
Shifts point toward metabolic acidosis or alkalosis depending on direction. Nurses pair this value with arterial blood gas results for a complete acid-base assessment.
- Normal range: 23-29 mmol/L.
- Low suggests: Metabolic acidosis, kidney disease.
- High suggests: Metabolic alkalosis, prolonged vomiting.
13. Blood Urea Nitrogen (BUN)
Blood urea nitrogen reflects how well the kidneys filter waste and hints at hydration status. It rises quickly with fluid loss, high protein intake, or reduced kidney filtration.
Nurses pair BUN with creatinine for a more accurate kidney function reading during evaluation.
- Normal range: 8-21 mg/dL.
- Low suggests: Liver disease, malnutrition.
- High suggests: Dehydration, kidney impairment.
14. Creatinine
Creatinine measures muscle breakdown waste filtered by the kidneys and serves as a steady baseline for kidney function.
Unlike BUN, it stays fairly stable regardless of diet or hydration. This makes it a dependable marker for tracking changes in kidney function over time.
- Normal range: 0.8-1.3 mg/dL
- Low suggests: Reduced muscle mass.
- High suggests: Impaired kidney filtration.
15. Glucose
Glucose measures blood sugar levels and reflects how well the body manages insulin and metabolism.
Both low and high readings can turn urgent fast, especially in critically ill or diabetic patients on insulin therapy.
- Normal range: 65-110 mg/dL
- Low suggests: Insulin excess, fasting.
- High suggests: Diabetes, acute illness, stress.
16. Calcium
Calcium supports bone strength, muscle contraction, and nerve signaling throughout the body.
Both low and high levels carry serious risks and often connect back to parathyroid or kidney function during assessment.
- Normal range: 8.5-10.2 mg/dL
- Low suggests: Hypoparathyroidism, vitamin D deficiency.
- High suggests: Hyperparathyroidism, malignancy.
Thyroid and Iron Panel Basics
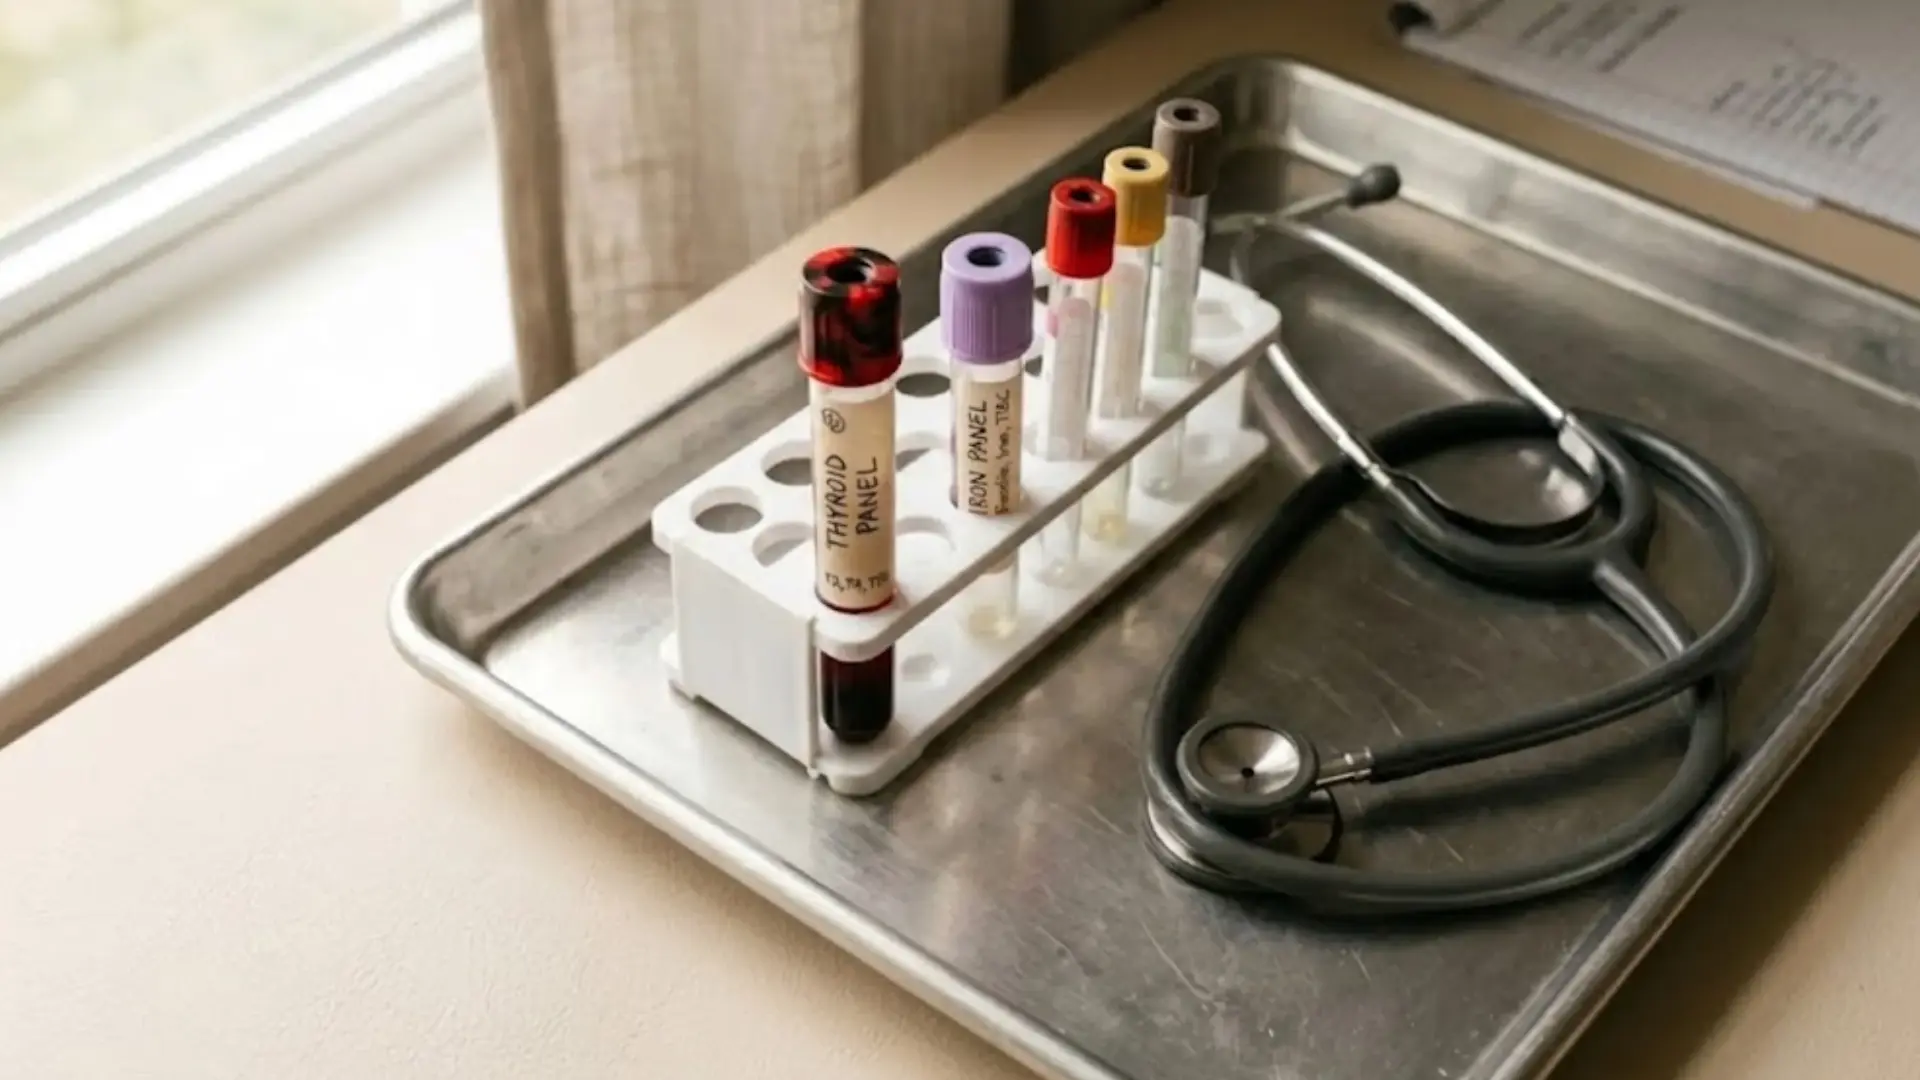
Blood tests reveal a lot about how the body works behind the scenes. Thyroid and iron levels are two of the most common panels doctors order, and each one comes with its own set of markers worth breaking down:
17. Thyroid Hormones (TSH, T4, T3) Lab Values
Thyroid hormones control metabolism, energy levels, and body temperature, with TSH telling the thyroid how much hormone to produce, keeping its normal range between 0.5 and 5 mIU/L.
T4 is the main hormone the thyroid releases, while T3 is the active form the body actually uses, with total T4 falling between 4.9 and 11.7 mg/dL and total T3 ranging from 0.7 to 1.5 ng/dL.
High TSH usually points to hypothyroidism, while low TSH signals hyperthyroidism.
18. Iron Panel Lab Values
The iron panel measures four connected markers; reading all four together gives a clearer diagnosis than any single value alone:
Marker | What It Measures | Normal Range | Low Level Suggests | High Level Suggests |
Total Serum Iron | Circulating iron in blood | Male: 65-180 µg/dL; Female: 30–170 µg/dL | Iron deficiency, blood loss | Iron overload, hemolysis |
Ferritin | Stored iron reserves | Male: 12-300 ng/mL; Female: 12-150 ng/mL | Depleted iron stores | Inflammation, iron overload |
Transferrin | Protein carrying iron | 200-350 mg/dL | Iron overload, liver disease | Iron deficiency response |
Total Iron-Binding Capacity | Transferrin’s spare capacity | 45-85 µmol/L | Iron overload, malnutrition | Iron deficiency anemia |
High TIBC paired with low ferritin points strongly toward iron deficiency, while low TIBC with high ferritin suggests overload. Providers often add transferrin saturation for a complete iron status assessment.
Liver Function Tests (LFT) Lab Values
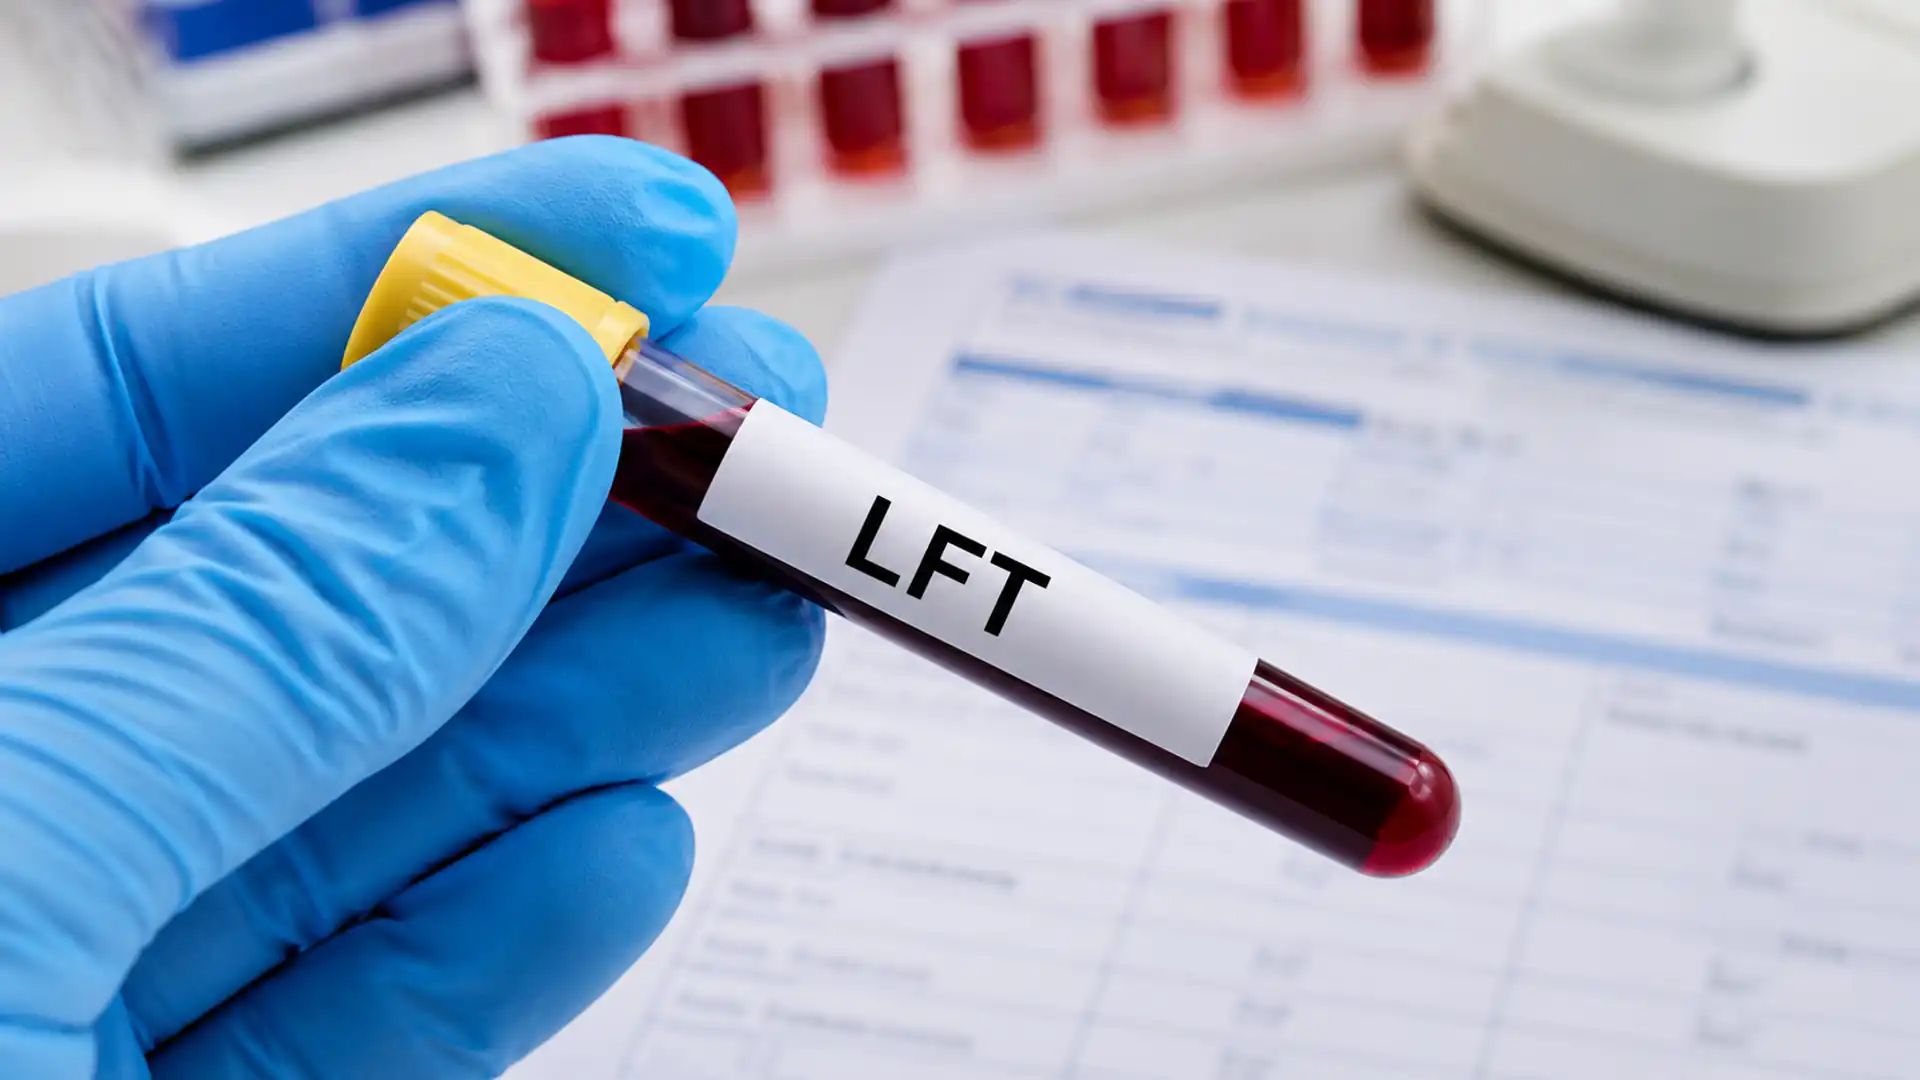
Liver function tests check how well the liver processes toxins and builds proteins. Order this panel to catch liver damage or bile flow issues early, and each marker carries its own range worth a closer look:
19. Alkaline Phosphatase (ALP)
Alkaline phosphatase is an enzyme found in the liver, bones, and bile ducts.
Elevated readings often point toward blocked bile flow rather than direct liver cell injury. Physicians pair ALP with GGT to confirm whether the source is liver- or bone-related.
- Normal range: 50-100 U/L
- Low suggests: Malnutrition, zinc deficiency.
- High suggests: Bile duct blockage, bone disease.
20. Alanine Aminotransferase (ALT)
Alanine aminotransferase lives mainly inside liver cells and spills into the bloodstream once those cells get damaged. It rises faster than most other markers during acute liver stress.
Physicians treat ALT as the most liver-specific enzyme on this panel.
- Normal range: 5-30 U/L
- Low suggests: Rarely clinically significant.
- High suggests: Hepatitis, fatty liver, drug injury.
21. Aspartate Aminotransferase (AST)
Aspartate aminotransferase appears in the liver, heart, and muscle tissue, so it lacks the liver specificity of ALT.
Physicians compare AST against ALT to judge whether alcohol use or muscle damage explains an abnormal reading. A ratio favoring AST often points toward alcohol-related injury.
- Normal range: 5-30 U/L
- Low suggests: Rarely clinically significant
- High suggests: Alcohol injury, muscle damage
22. Albumin
Albumin is a protein the liver manufactures to keep fluid inside blood vessels and transport hormones.
Because production takes weeks to slow down, albumin reflects long-term liver function rather than sudden changes. Physicians use falling albumin as a sign of chronic rather than acute liver disease.
- Normal range: 35-50 g/L
- Low suggests: Chronic liver disease, malnutrition
- High suggests: Dehydration, rare clinical cause
23. Prealbumin
Prealbumin is another liver-made protein, but it turns over far faster than albumin, making it useful for tracking short-term nutritional shifts.
Dietitians and physicians rely on prealbumin to catch malnutrition days before albumin levels would even begin to shift.
- Normal range: 15-36 mg/dL
- Low suggests: Acute malnutrition, inflammation.
- High suggests: Dehydration, steroid use.
24. Total Protein
Total protein adds up albumin plus globulins, giving a broader snapshot of liver and immune protein production.
Abnormal readings often need follow-up testing to identify which specific protein fraction is driving the change. Physicians use this value as a starting point rather than a final answer.
- Normal range: 60-80 g/L
- Low suggests: Liver disease, kidney loss.
- High suggests: Chronic inflammation, infection.
25. Total Bilirubin
Total bilirubin measures the yellow pigment released when old red blood cells break down, which the liver normally clears from the body.
Rising levels cause the yellowing of skin and eyes known as jaundice. Physicians check bilirubin trends closely in newborns and patients with suspected bile obstruction.
- Normal range: 2-20 µmol/L
- Low suggests: Rarely clinically significant
- High suggests: Jaundice, bile obstruction, hemolysis
26. Amylase
Amylase is an enzyme produced mainly by the pancreas, though the liver panel often includes it to rule out overlapping abdominal symptoms.
Sudden spikes point toward pancreatic inflammation rather than liver dysfunction itself. Physicians order amylase alongside lipase when pancreatitis is suspected.
- Normal range: 30-125 U/L
- Low suggests: Advanced pancreatic damage.
- High suggests: Acute pancreatitis, duct blockage.
Heart and Kidney Screening Panels
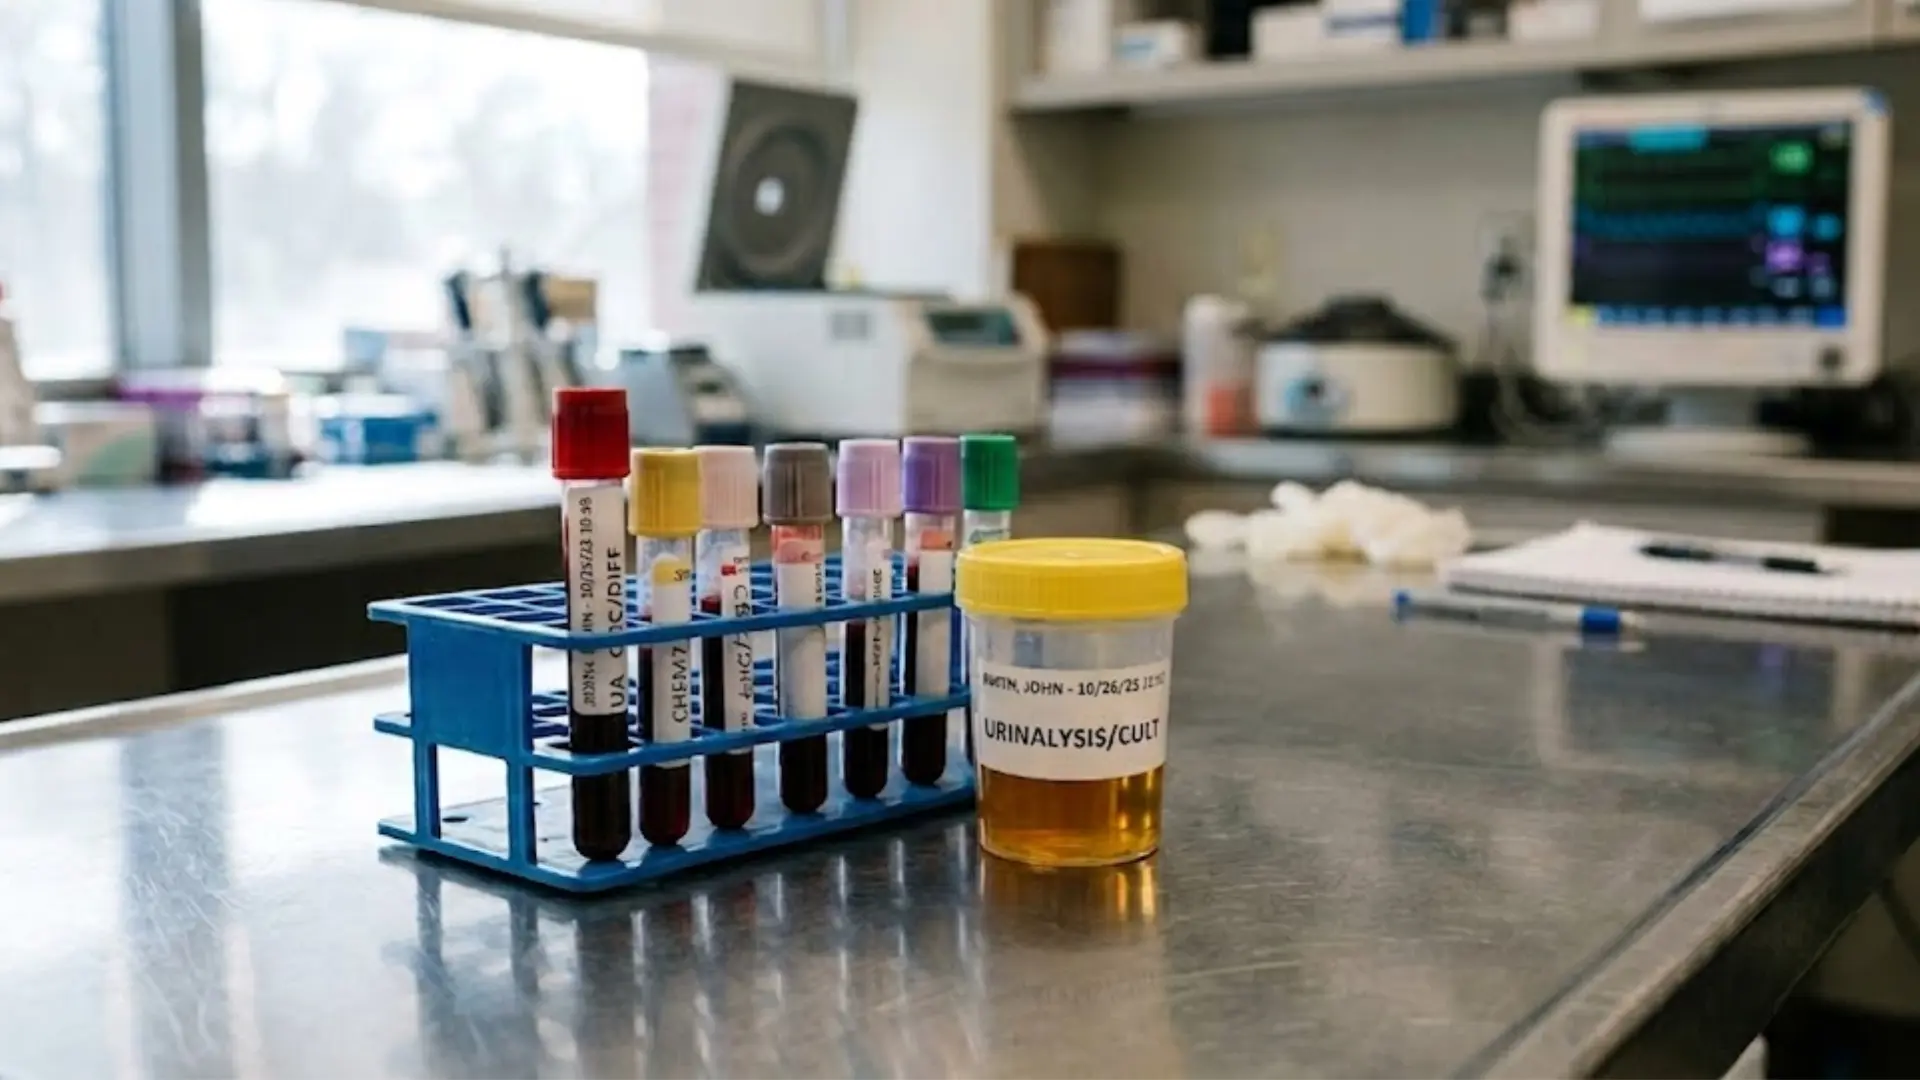
Cardiac markers and cholesterol values show how the heart handles strain and fat buildup. Urinalysis checks the kidneys and urinary tract through simple chemical markers in urine. Here is what each panel reveals:
27. Cardiac Markers and Cholesterol Panel
Cardiac markers help doctors spot heart muscle damage after chest pain or a suspected heart attack.
Creatine kinase (CK) rises with any muscle injury, ranging from 25 to 200 U/L, while troponin rises only when heart muscle cells get damaged, making 0 to 0.4 ng/mL the most trusted marker.
The cholesterol panel shows how much fat circulates in the blood. Total cholesterol should stay under 200 mg/dL, LDL should fall between 85 and 125 mg/dL, and HDL should stay between 40 and 80 mg/dL.
28. Urinalysis Lab Values
Urinalysis checks the kidneys and urinary tract by testing chemical markers in a urine sample. Use it to catch infections, dehydration, and metabolic problems early. Here’s what it covers:
Marker | What It Measures | Normal Finding | Abnormal Suggests | Clinical Note |
pH | Urine acidity level | 5-8 | Diet, infection, kidney issue | Extreme values need recheck |
Protein | Kidney filter leakage | Negative | Kidney disease, dehydration | Confirm with repeat sample |
Specific Gravity | Urine concentration | 1.002-1.030 | Dehydration, overhydration | Reflects hydration status |
Leukocyte Esterase | White cell enzyme presence | Negative | Urinary tract infection | Pair with nitrite result |
Nitrites | Bacterial byproduct | Negative | Bacterial infection | Confirms leukocyte finding |
Glucose | Sugar in urine | Negative | Diabetes, high blood sugar | Rare without high serum glucose |
WBCs & RBCs | Blood and immune cells | 0-5/hpf | Infection, kidney injury | Warrants urine culture |
Positive leukocyte esterase paired with nitrites strongly suggests an active urinary tract infection, and any unexpected protein or blood calls for follow-up testing.
29. HbA1c and Miscellaneous Lab Values
HbA1c reflects average blood sugar over two to three months, while the miscellaneous values below cover inflammation, clotting, and kidney output:
- HbA1c (3.9-6.2%): Shows long-term blood sugar control; rises with diabetes
- BNP (< 100 pg/mL): Released by strained heart muscle, rises with heart failure
- CRP (< 5 mg/L): Marks active inflammation, rises with infection or injury
- D-Dimer (< 500 ng/mL): Signals clot breakdown, rises with blood clots or embolism
- LDH (50-150 U/L): Released during tissue damage, rises with cell injury or cancer
These markers need clinical context before drawing conclusions, since symptoms and patient history shape how each result gets interpreted.
Note: This blog uses reference ranges from NCBI Bookshelf’s Normal Reference Ranges for accuracy. Individual lab ranges vary by hospital, so always confirm values with a physician or lab report.
Brain-Friendly Ways to Memorize Nursing Lab Values
Long charts full of numbers rarely stick after one read-through, and nursing students end up relearning the same values before every exam.
These five strategies turn scattered figures into patterns the brain actually holds onto:
- Group values by body system: Sort electrolytes, renal markers, and blood counts into small clusters instead of one long list. Example: keep sodium, potassium, and chloride together under one electrolyte group.
- Turn numbers into images: Attach each value to an object it resembles or sounds like. Example: imagine a banana with a mustache to recall potassium’s 3.5 to 5 range.
- Build short mnemonics for each panel: Link the test name to its function through a memorable phrase. Example: “bunions hurt” for BUN’s normal range of 10 to 20.
- Practice active recall daily: Quiz from memory before checking the chart instead of just rereading notes. Example: cover the value column and say each number aloud first.
- Teach the values to a classmate: Explaining a value out loud forces the brain to organize it properly. Example: walk a study partner through why low sodium causes confusion.
Repeating these five habits across several short sessions turns scattered facts into lasting clinical knowledge.
Final Words
Reading through lab values in nursing charts gets easier once the pattern clicks. Each panel points to a different part of the body.
Blood counts flag infection and bleeding risk fast. Metabolic panels flag kidney stress and fluid problems early. Liver panels flag organ damage before symptoms show up.
Pairing values together gives a clearer answer than reading it alone. Grouping values by system makes them easier to recall on shift. Mnemonics turn dry numbers into memory that sticks.
Drop your favorite memory trick for lab values in the comments below.
Frequently Asked Questions
What is a Critical Lab Value in Nursing?
A critical lab value falls far outside the normal range and signals an emergency, requiring the nurse to notify the provider immediately for safe intervention.
Why Do Normal Lab Value Ranges Vary Between Hospitals?
Different labs use different equipment, reagents, and calibration methods, so reference ranges shift slightly, making it necessary to check each hospital’s own chart.
How Often Should Nurses Recheck Abnormal Lab Values?
Recheck timing depends on severity and the ordering provider’s instructions, though most abnormal or critical values are repeated within one to four hours.
How are PT, PTT, and INR Different?
PT and PTT measure two different parts of the clotting process, while INR standardizes the PT result across labs. Nurses trend PT/INR for warfarin and aPTT for heparin, since each drug affects a different part of the clotting cascade.